Submit an Article
Navigate
Home
Editorial Board
Editorial Policies
Current Volume
Archive
Scientific Integrity
Publication Ethics Statements
Interviews with Outstanding Authors
Newsroom
Sponsored Conferences
Podcast
Contact
Special Collections
Submit an Article
Online ISSN: 1945-4589
Research Paper
|
Volume 13, Issue 18
|
pp. 22059–22077
Sex, rurality and socioeconomical status in Spanish centennial population (2017)
Back to article
Figure 10
(10 of 12)
−
100%
+
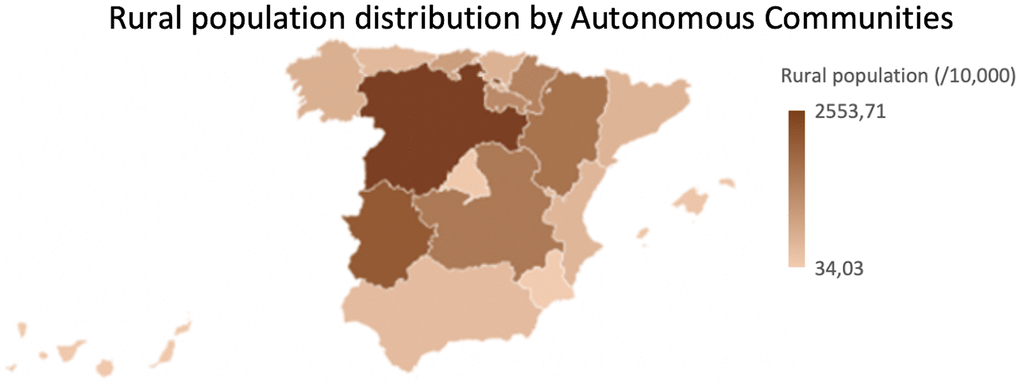
Figure 10.
Rural population distribution by Autonomous Communities.
Normalized rural population (per 10.000 inhabitants) by Autonomous Communities.
Figure 10 — Sex, rurality and socioeconomical status in Spanish centennial population (2017) | Aging