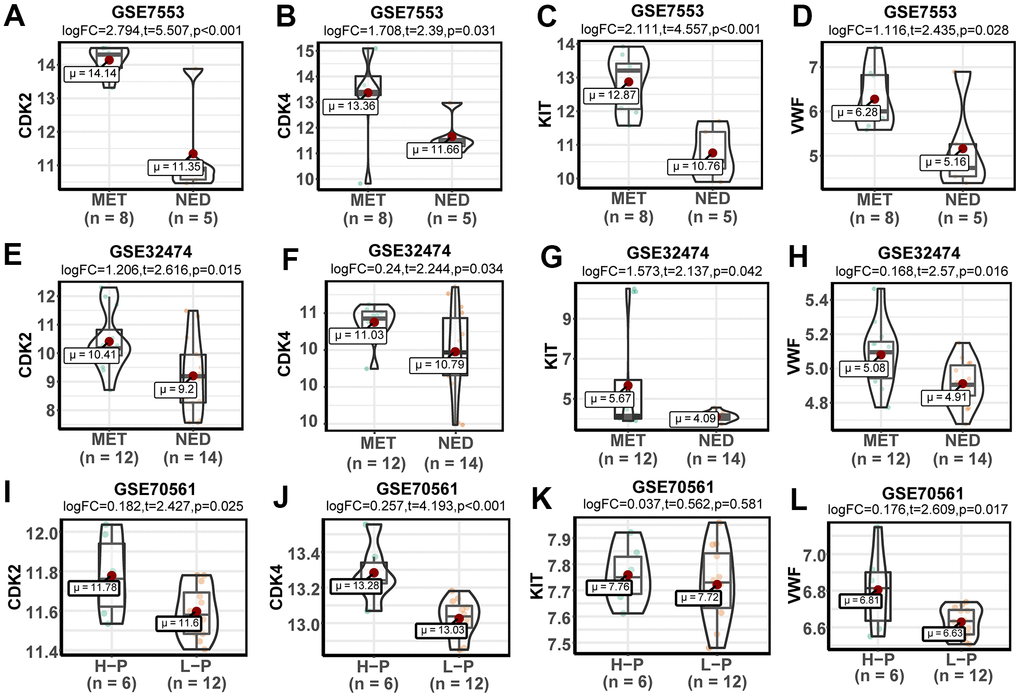
Figure 3.Expression and verification of key genes. (A–D) Violin plots of the expression levels of key genes in the GSE7553 dataset. (E–H) Violin plots of the expression levels of key genes in the GSE32474 dataset. (I–L) Violin plots of the expression levels of key genes in the GSE70561 dataset.