Submit an Article
Navigate
Home
Editorial Board
Editorial Policies
Current Volume
Archive
Scientific Integrity
Publication Ethics Statements
Interviews with Outstanding Authors
Newsroom
Sponsored Conferences
Podcast
Contact
Special Collections
Submit an Article
Online ISSN: 1945-4589
Research Paper
|
Volume 13, Issue 18
|
pp. 22474–22489
Identification of genes and pathways leading to metastasis and poor prognosis in melanoma
Back to article
Figure 2
(2 of 9)
−
100%
+
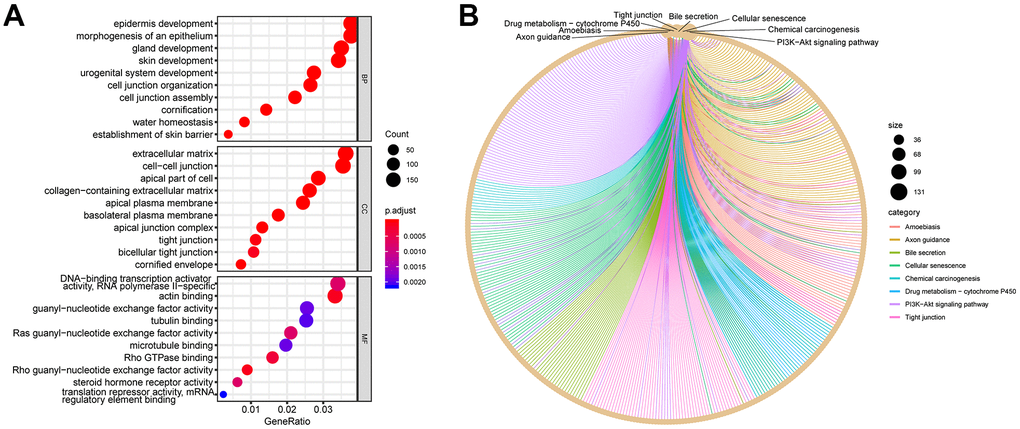
Figure 2.
GO and KEGG plots calculated using DEGs.
(
A
) GO dot plot: top 10 items in each category. (
B
) KEGG network plot: top eight pathway items calculated using DEGs. The surrounding dots represent genes.