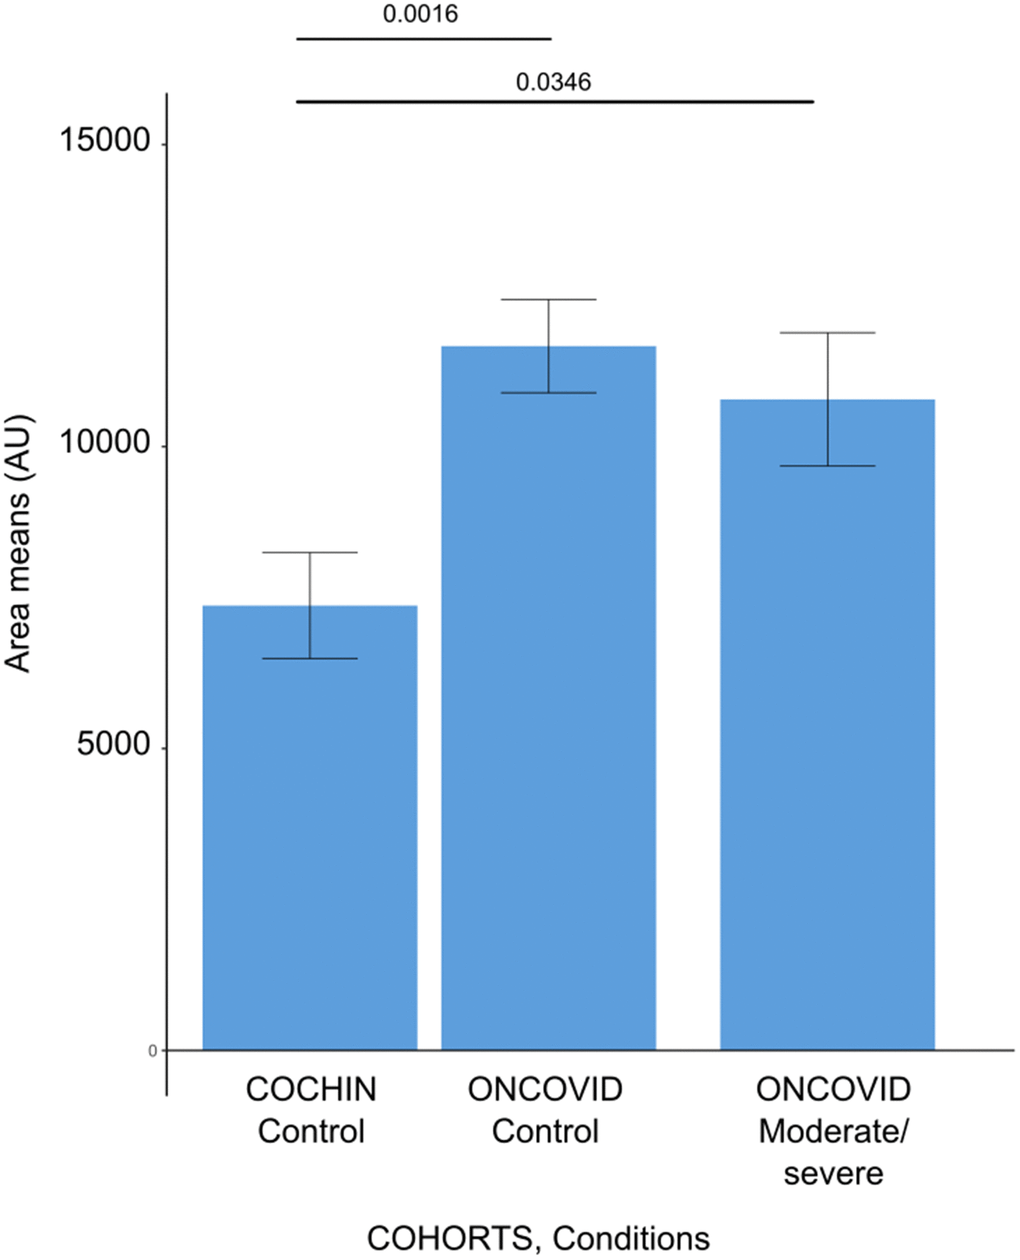
Figure 8.Anthranilic acid levels in different patient cohorts. Barplots demonstrating the anthranilic acid area levels for each subject issued from the cancer-free and Covid-19-free control cohort (COCHIN Control), previously described by Danlos et al., [45], and our dataset of cancer patients without Covid-19 (ONCOVID controls) and the cancer patients with moderate or severe Covid-19 (ONCOVID Moderate/Severe). Error bars show standard errors of the mean.
Figure 8 — Circulating acetylated polyamines correlate with Covid-19 severity in cancer patients | Aging