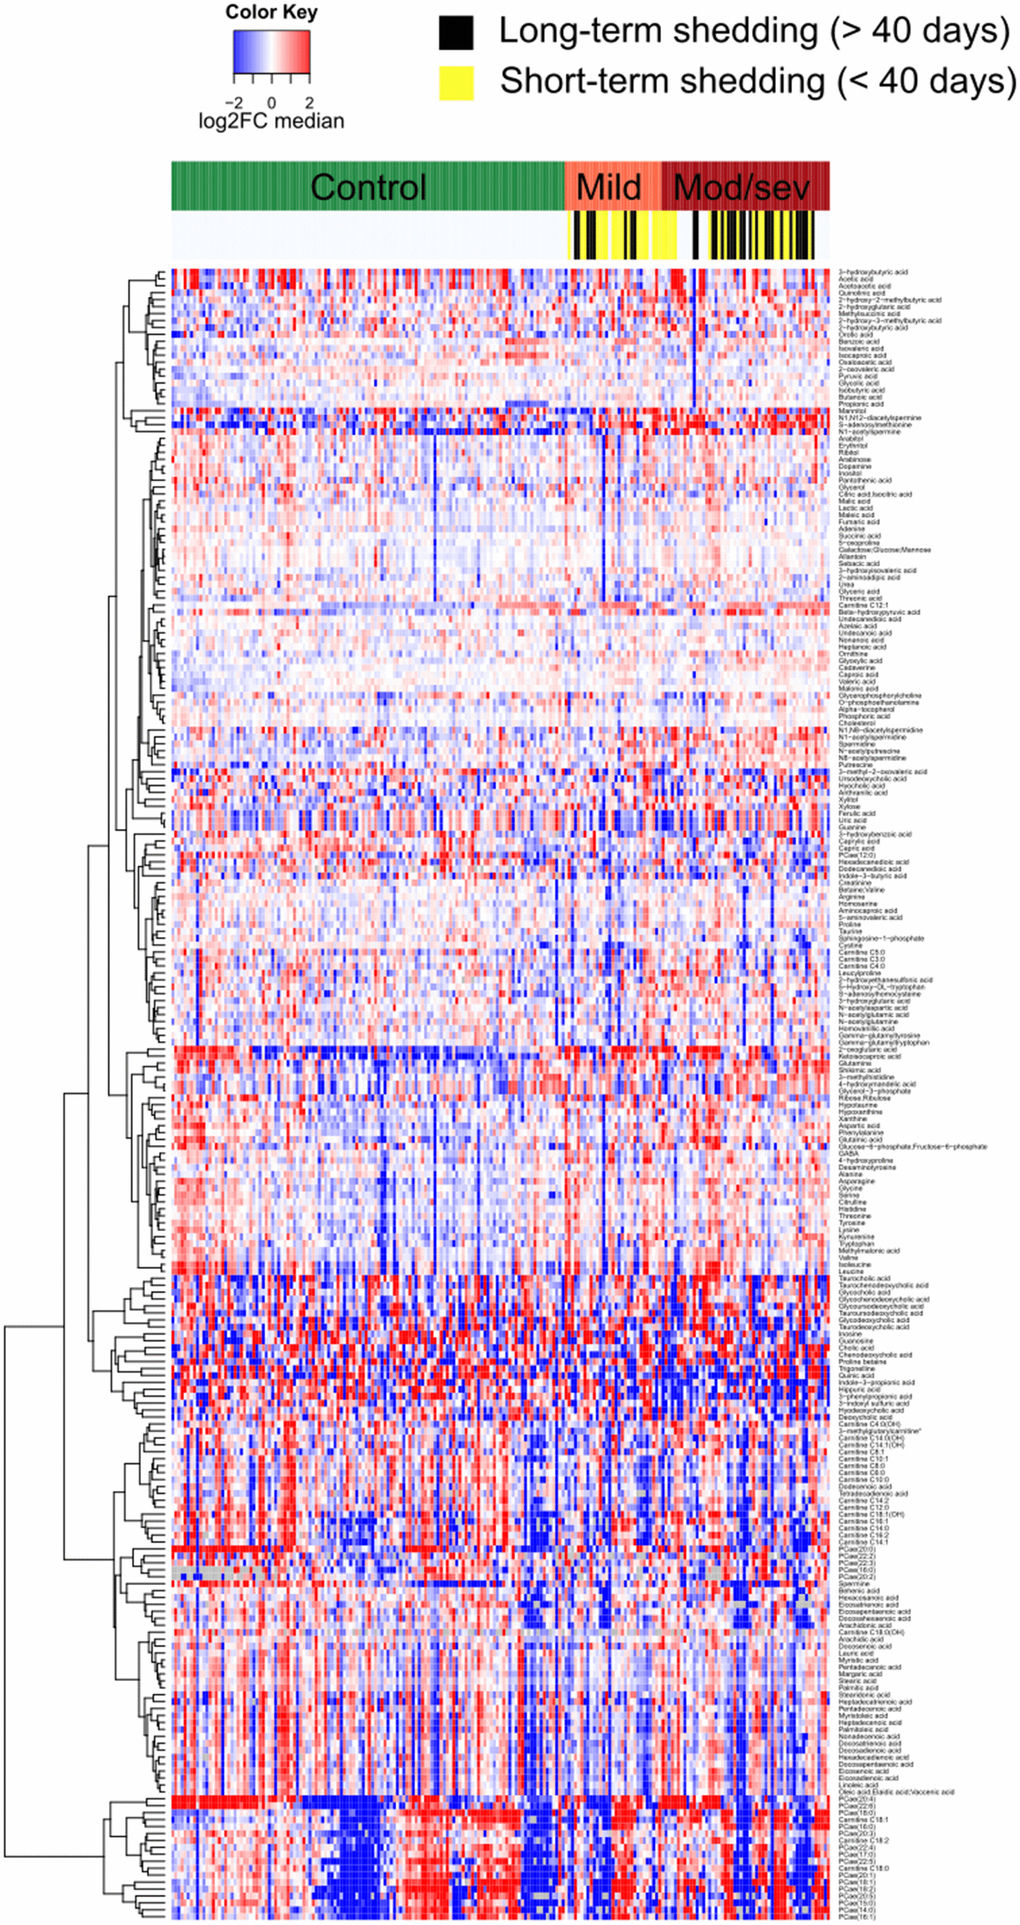
Figure 1.Heatmap representing the serum metabolome of each individual cancer patient clustered by clinical severity of Covid-19. Targeted metabolomic data on 211 serum samples from 204 patients were normalized areas of identified metabolites. Results are listed in Supplementary Table 1.
Figure 1 — Circulating acetylated polyamines correlate with Covid-19 severity in cancer patients | Aging