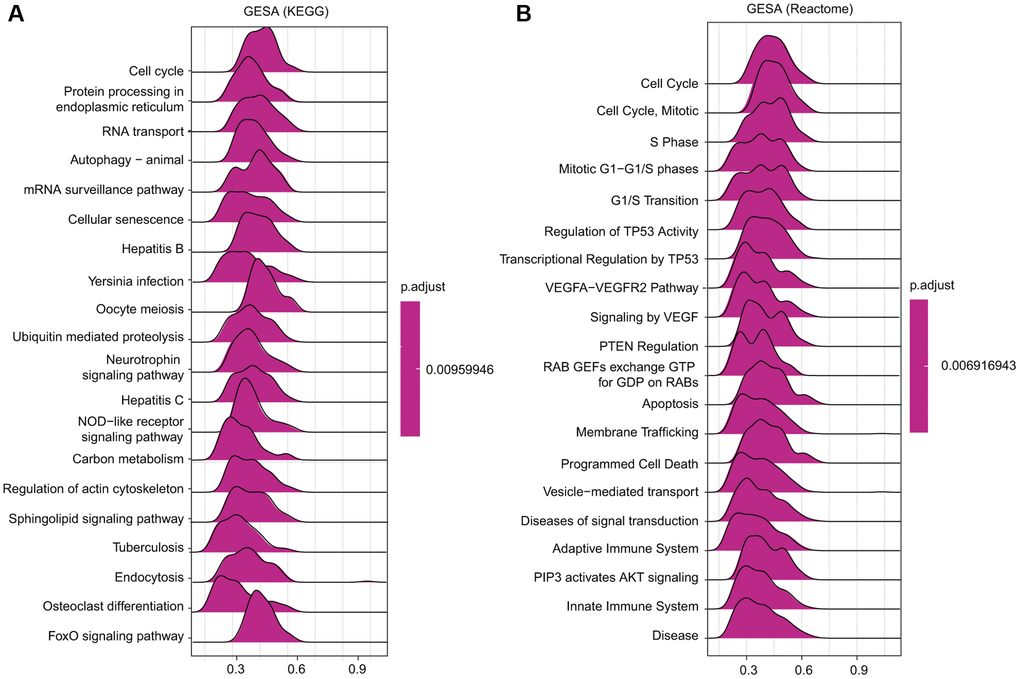
Figure 10.Merged enrichment plots obtained by GSEA. (A–B) Merged plots showing the enriched signaling pathways correlated with TfR1 expression based on KEGG analysis and Reactome analysis in BC.
Figure 10 — Integrated analysis identifies TfR1 as a prognostic biomarker which correlates with immune infiltration in breast cancer | Aging