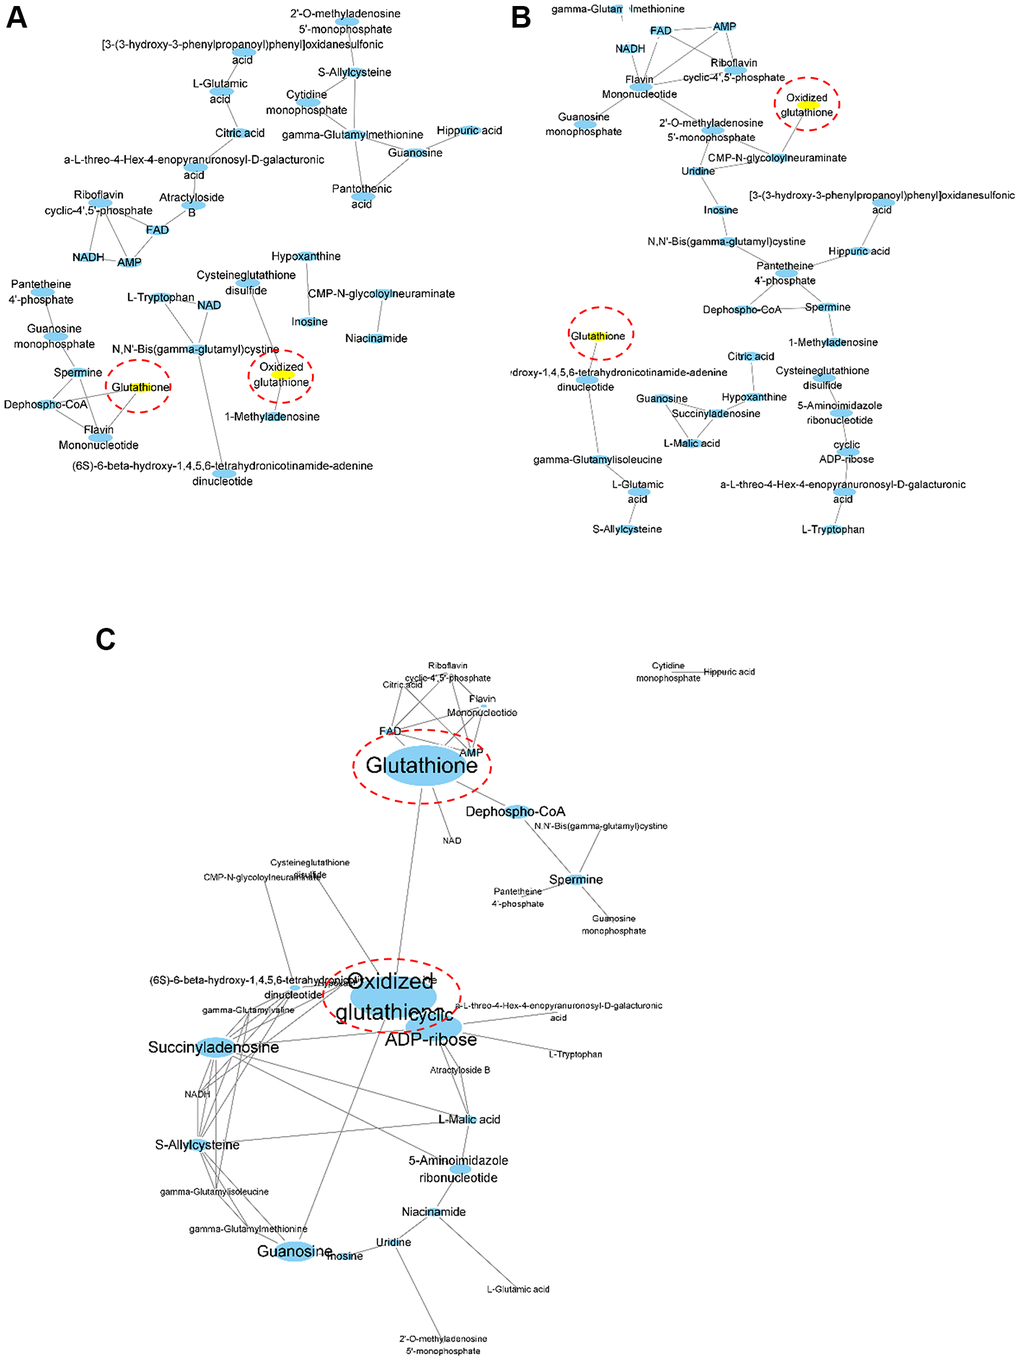
Figure 2.Correlation coefficient-based network analysis results. Network visualization of the correlation-based relationships among profiled aqueous metabolites was performed for young (A, n = 7), old (B, n = 8) and mixed (C, n = 15) groups. Oxidized glutathione and glutathione are highlighted in yellow for (A) and (B). The width and height of the nodes were scaled using the stress centrality measurements for (C).