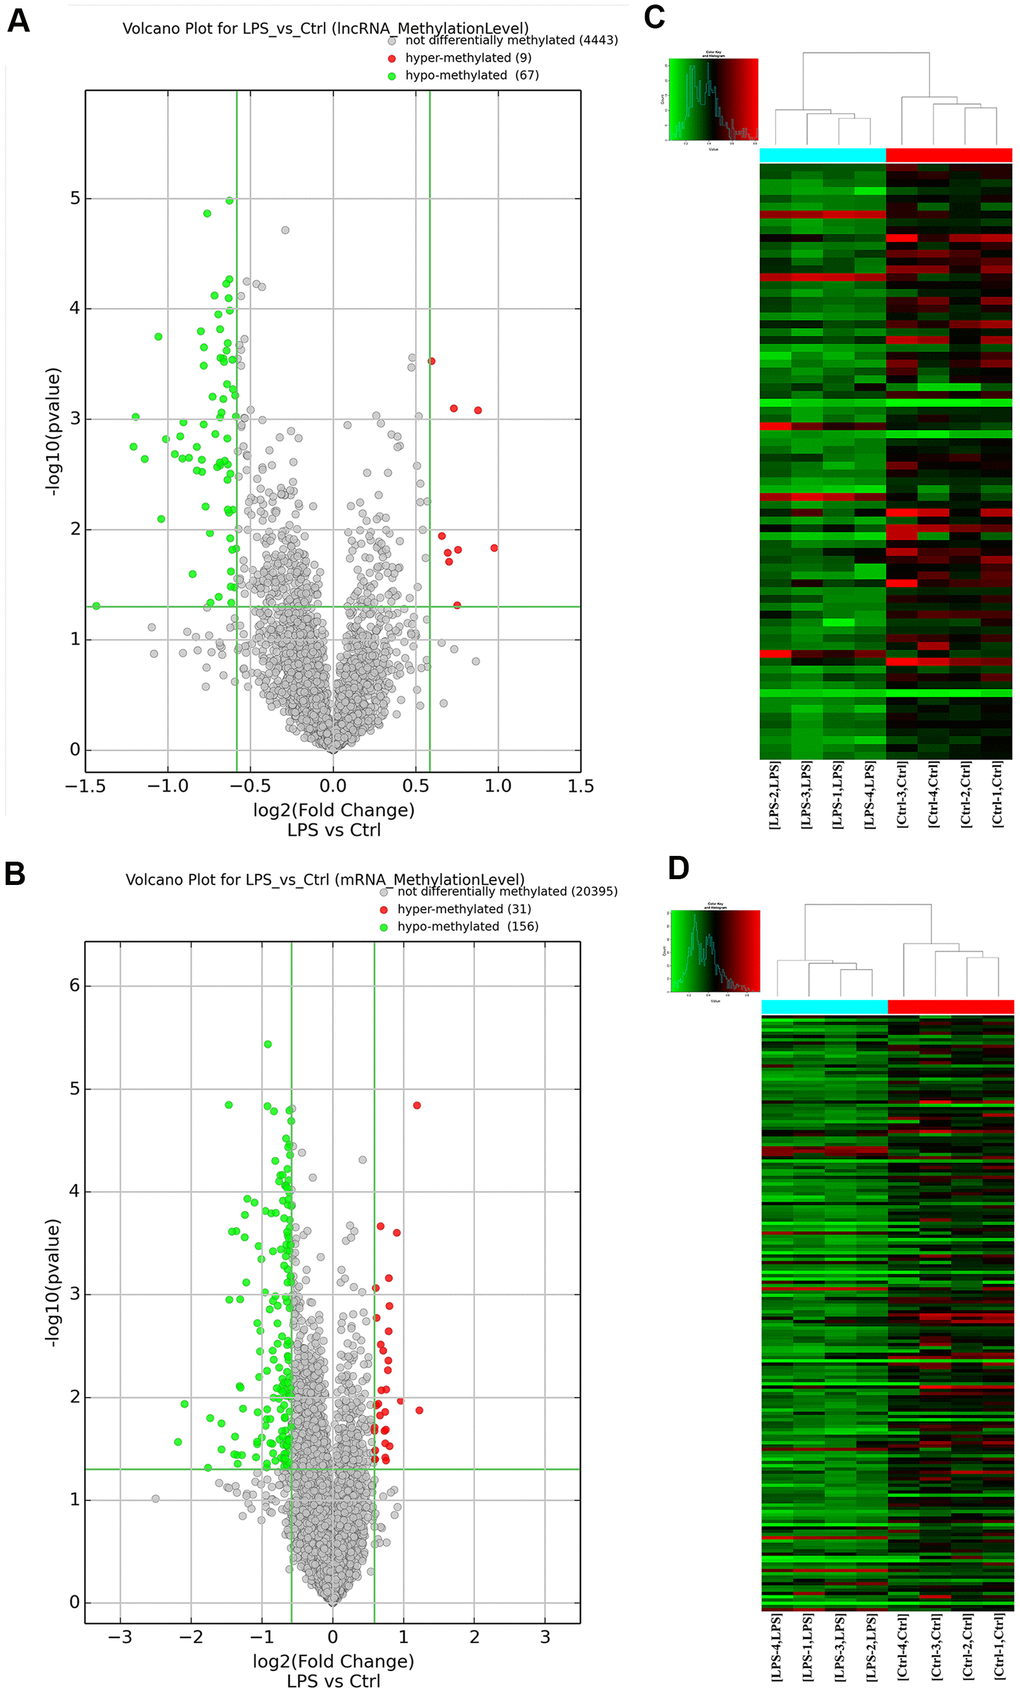
Figure 2.Overview of the m6A methylation map in aortic tissues. (A) Scatter plots showing differentially methylated lncRNAs. (B) Scatter plots showing differentially methylated mRNAs. (C) Hierarchical clustering analysis of lncRNAs with significantly altered m6A levels. (D) Hierarchical clustering analysis of mRNAs with significantly altered m6A levels. Ctrl, control.