Submit an Article
Navigate
Home
Editorial Board
Editorial Policies
Current Volume
Archive
Scientific Integrity
Publication Ethics Statements
Interviews with Outstanding Authors
Newsroom
Sponsored Conferences
Podcast
Contact
Special Collections
Submit an Article
Online ISSN: 1945-4589
Research Paper
|
Volume 13, Issue 17
|
pp. 21599–21609
Association between tooth loss rate and risk of mild cognitive impairment in older adults: a population-based longitudinal study
Back to article
Figure 1
(1 of 3)
−
100%
+
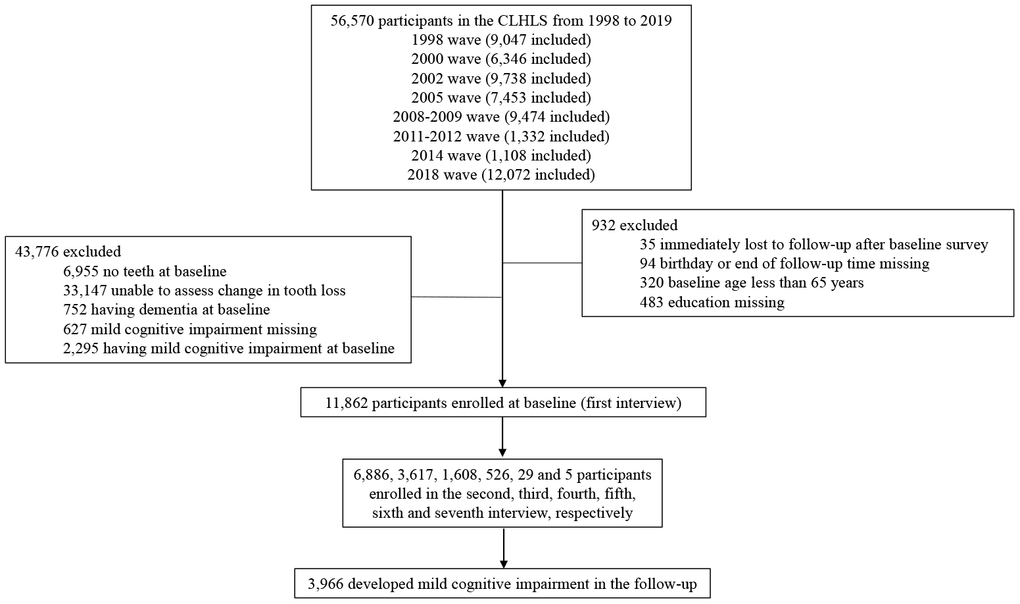
Figure 1.
Flow chart of selecting study population from the Chinese longitudinal healthy longevity survey during 1998-2019.