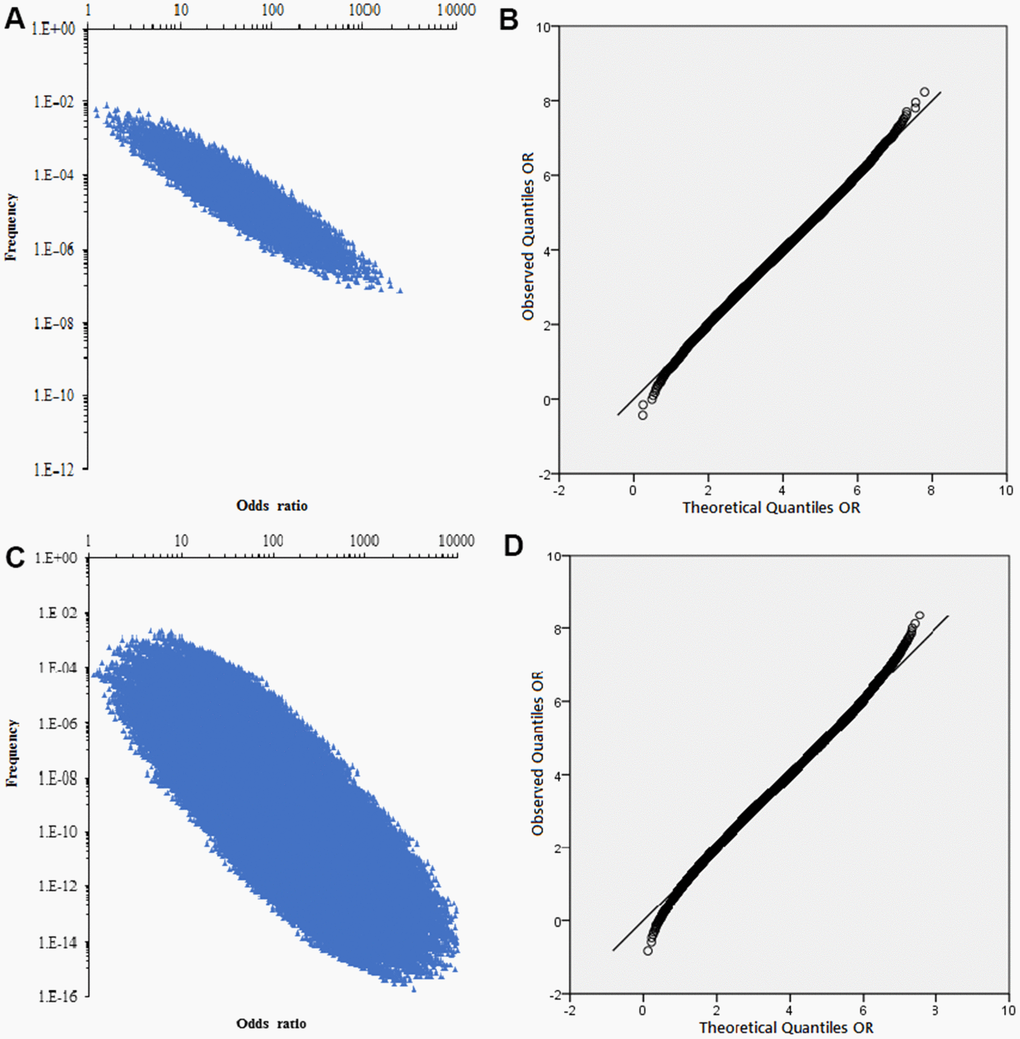
Figure 5.The combined distribution of the correlation strength and Q-Q normal distribution plot. (A) The combined distribution of the correlation strength (OR) of the 13 risk factors and the accumulation frequency. (B) Q-Q normal distribution plot of non-genetic factor accumulation frequency OR. (C) The combined distribution of the correlation strength (OR) of the 22 SNPs and the accumulation frequency. (D) Q-Q normal distribution plot of genetic factor accumulation frequency OR.