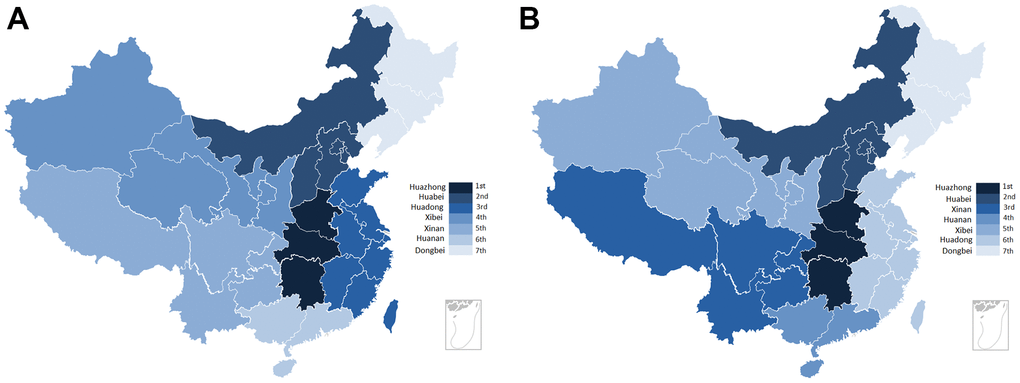
Figure 2.The distribution of H. pylori infection rate for gastric cancer and population in each province. (A) The regional distribution of H. pylori infection for population in China. (B) The regional distribution of H. pylori infection for gastric cancer in China.