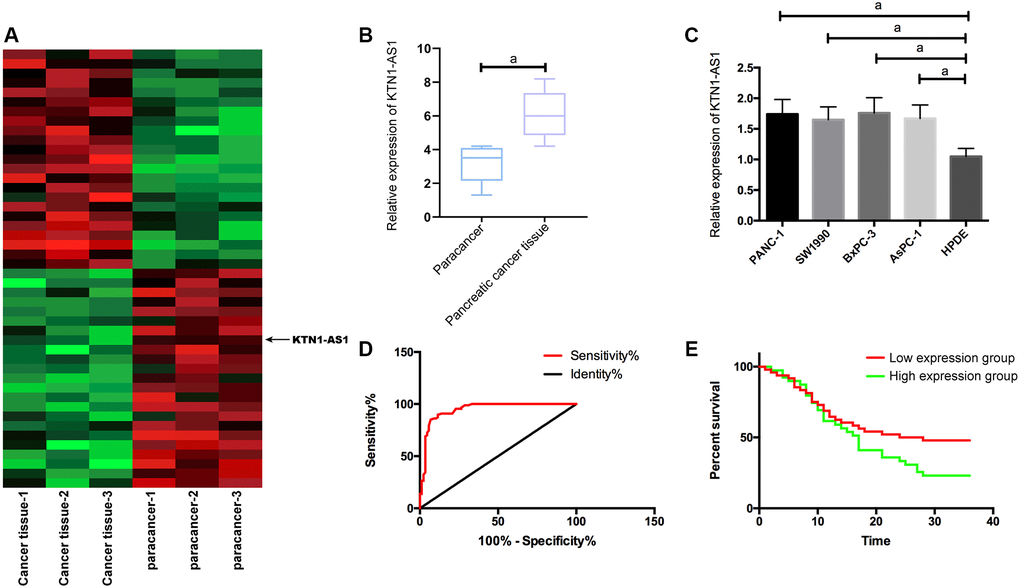
Figure 1.KTN1-AS1 expression and significance in PC. (A) Heatmap of differentially expressed lncRNAs in the RNA-seq analysis of clinical PC tissue and paracancer tissues, fold change ≥ 2 and P value < 0.05. (B) KTN1-AS1 expression in PC tissue. (C) KTN1-AS1 expression in pancreatic cancer cells. (D) ROC curve of KTN1-AS1 in the diagnosis of PC. (E) Effects of different KTN1-AS1 expression levels on the survival rate of patients with PC. a indicates P < 0.05.