Submit an Article
Navigate
Home
Editorial Board
Editorial Policies
Current Volume
Archive
Scientific Integrity
Publication Ethics Statements
Interviews with Outstanding Authors
Newsroom
Sponsored Conferences
Podcast
Contact
Special Collections
Submit an Article
Online ISSN: 1945-4589
Research Paper
|
Volume 13, Issue 17
|
pp. 21385–21399
Identification and validation of a ferroptosis-related gene signature predictive of prognosis in breast cancer
Back to article
Figure 5
(5 of 10)
−
100%
+
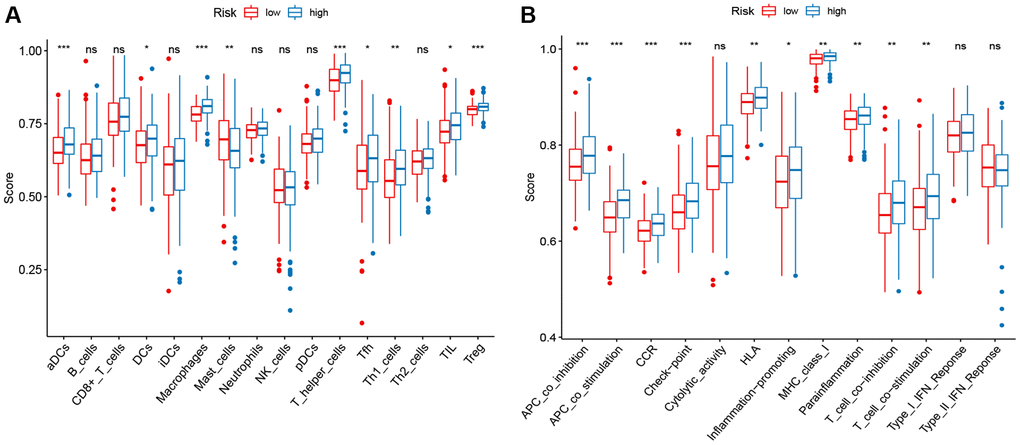
Figure 5.
ssGSEA scores in high-risk and low-risk patients in the TCGA set.
The scores of 16 immune cells (
A
) and 13 immune-related functions (
B
) are displayed in boxplots.