Submit an Article
Navigate
Home
Editorial Board
Editorial Policies
Current Volume
Archive
Scientific Integrity
Publication Ethics Statements
Interviews with Outstanding Authors
Newsroom
Sponsored Conferences
Podcast
Contact
Special Collections
Submit an Article
Online ISSN: 1945-4589
Research Paper
|
Volume 13, Issue 17
|
pp. 21385–21399
Identification and validation of a ferroptosis-related gene signature predictive of prognosis in breast cancer
Back to article
Figure 10
(10 of 10)
−
100%
+
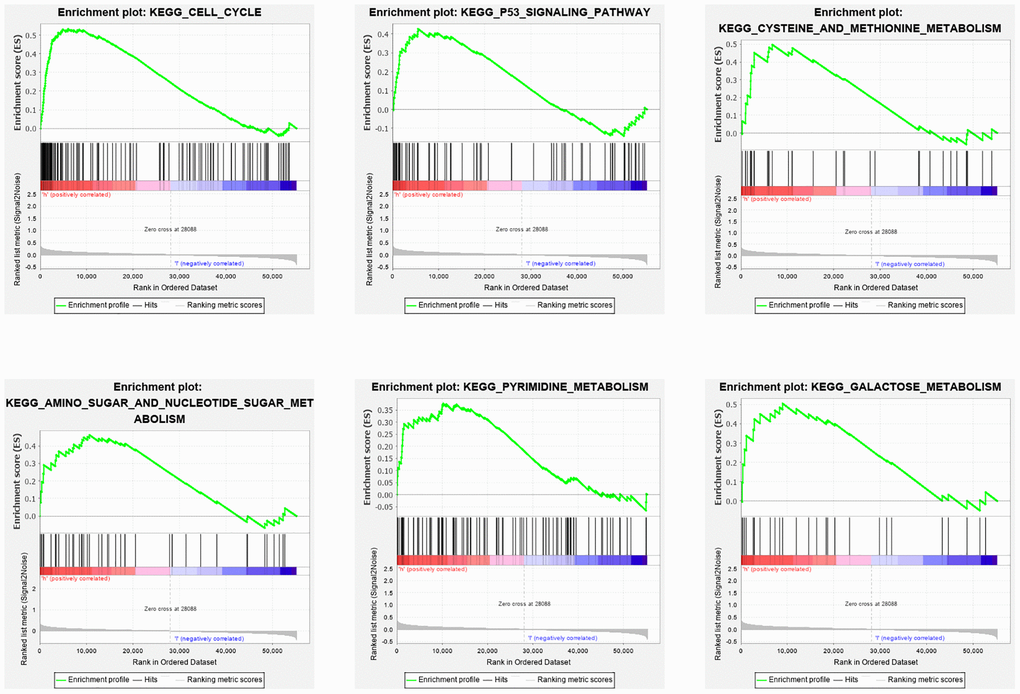
Figure 10.
GSEA analysis of differentially expressed genes in high and low risk groups.
The GSEA analysis revealed a remarkable enrichment of tumor and metabolism-related phenotypes in the high-risk group.