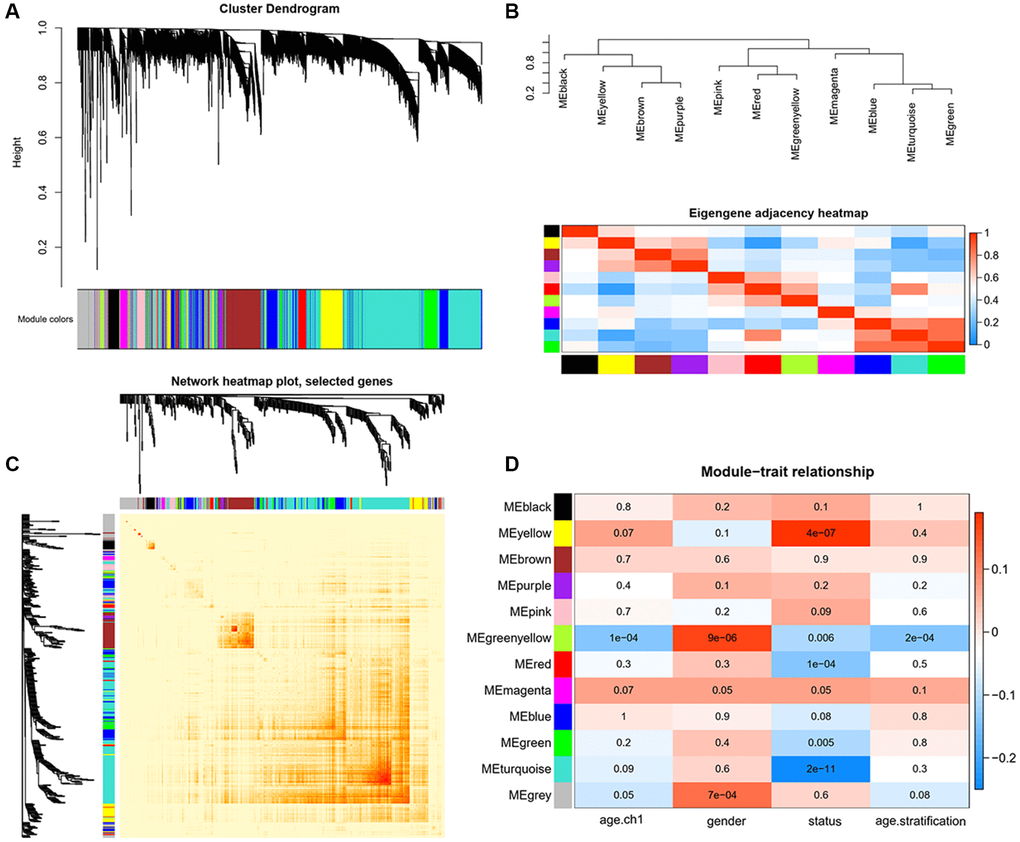
Figure 5.Identification of key modules correlated with clinical traits by WGCNA. (A) Cluster dendrograms of all genes, with dissimilarity based on topological overlap, and then various module colors were assigned. (B) The upper panel displays the hierarchical clustering dendrogram of hub genes that summarize the analyzed modules and branches of the dendrogram group with eigengenes are closely correlated. The lower panel shows the eigengene adjacency heatmap, with the trait weight included. The darker red color represents higher adjacency, while darker blue color represents low adjacency. (C) Heatmap plot of Topological Overlap Matrix (TOM) among selected genes. Each module corresponds to a branch in the hierarchical clustering dendrogram. Modules demonstrate more saturated yellow or even red colors indicate higher co-expression interconnection. Genes locate at the tip of each branch indicate highest interconnection with the rest of the genes in the module. (D) Heatmap of the associations between module eigengenes and clinical traits. Each row and column correspond to a module eigengene or a clinical trait. The plot is colored by corresponding correlation according to the legend, and each cell contains the corresponding P-value. The red color represents positive correlation, while blue color represents negative correlation.