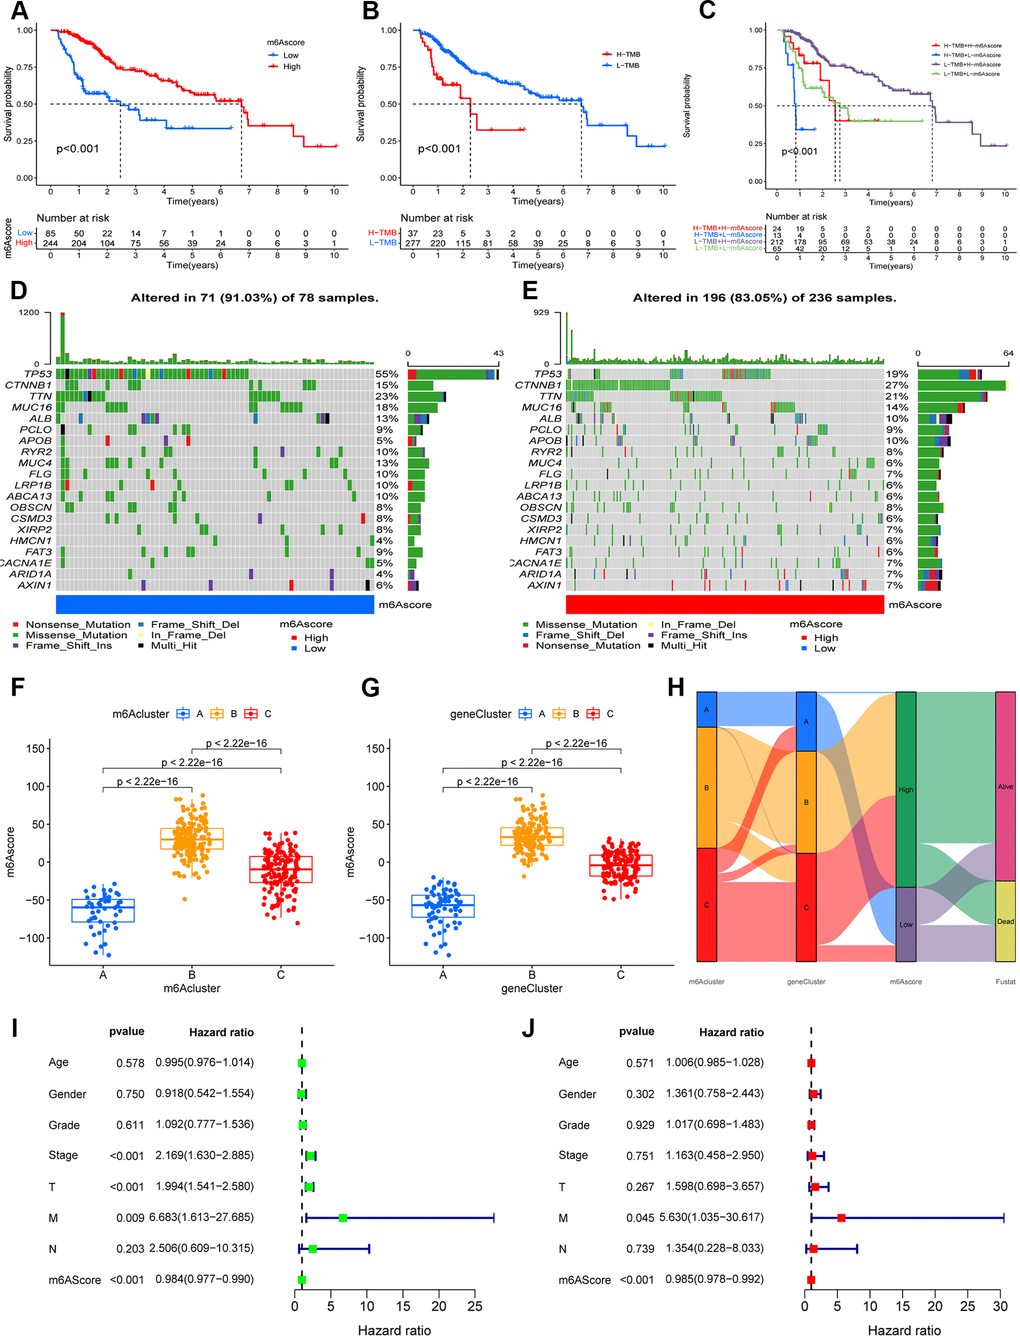
Figure 4.Construction the m6A-scoring signature. (A) The overall survival of m6A-scoring signature using Kaplan–Meier in Log-rank test. (B) The overall survival of low and high tumor mutation burden (TMB) score groups using Kaplan–Meier in Log-rank test. (C) The overall survival of the patients stratified by both the m6A-scoring signature and TMB using Kaplan–Meier curves. Mutation spectrum of the low (D) and high (E) m6A score groups. (F) Differences in m6A score group among three m6A methylation modification patterns (m6Acluster) (P < 0.001, Kruskal–Wallis test). (G) Differences in m6A score group among three m6A modification genomic phenotypes (geneCluster) (P < 0.001, Kruskal–Wallis test). (H) Alluvial diagram showing the changes of m6A methylation modification patterns (m6Acluster), m6A modification genomic phenotypes (geneCluster), m6Ascore, and survival status (Fustat). (I) Univariate COX analysis for the m6A-scoring signature. (J) Multivariate COX analysis for the m6A-scoring signature.