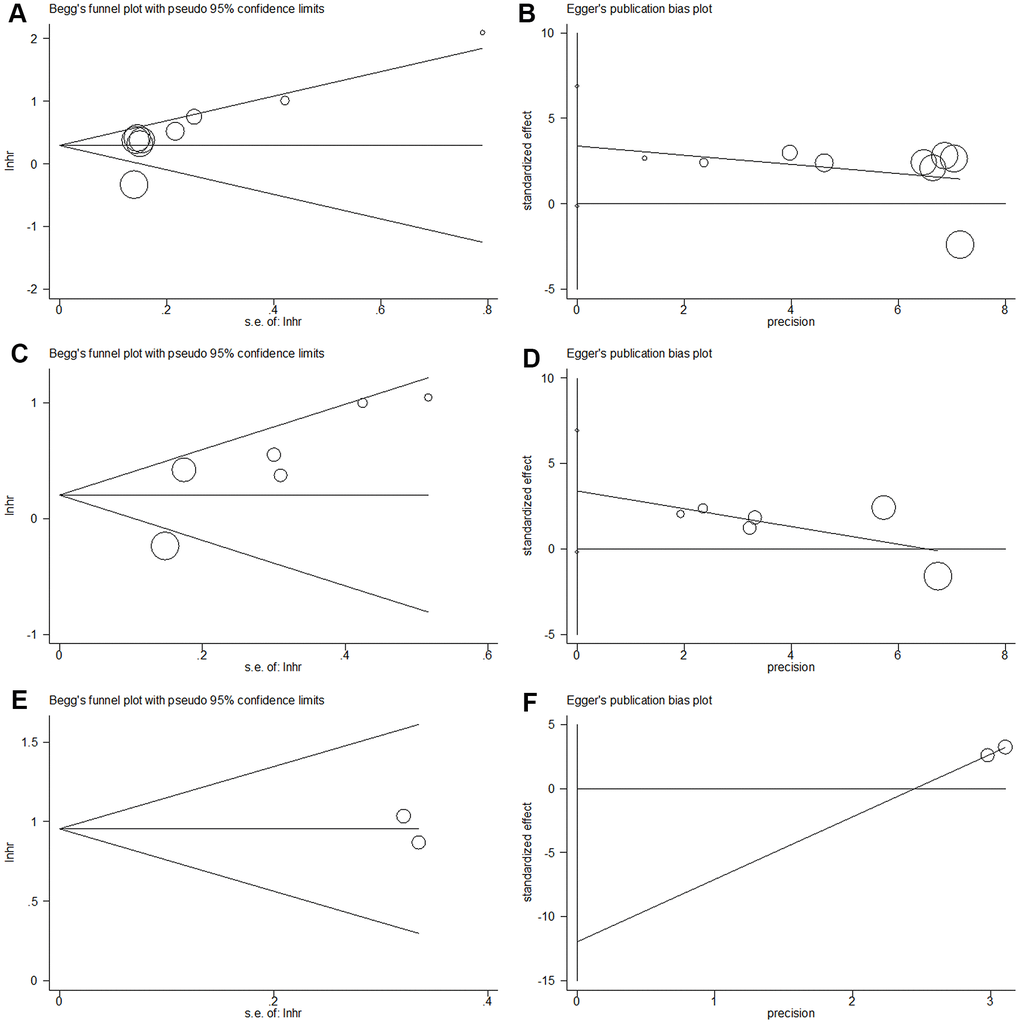
Figure 6.Begg’s funnel plot and Egger’s linear regression test for publication bias in this meta-analysis. (A) Begg’s funnel plot for OS (p=0.089); (B) Egger’s linear regression test for OS (p=0.057); (C) Begg’s funnel plot for RFS/PFS/DFS (p=0.260); (D) Egger’s linear regression test for RFS/PFS/DFS (p=0.160); (E) Begg’s funnel plot for CSS (p=1), and (F) Egger’s linear regression test for CSS (p=1).