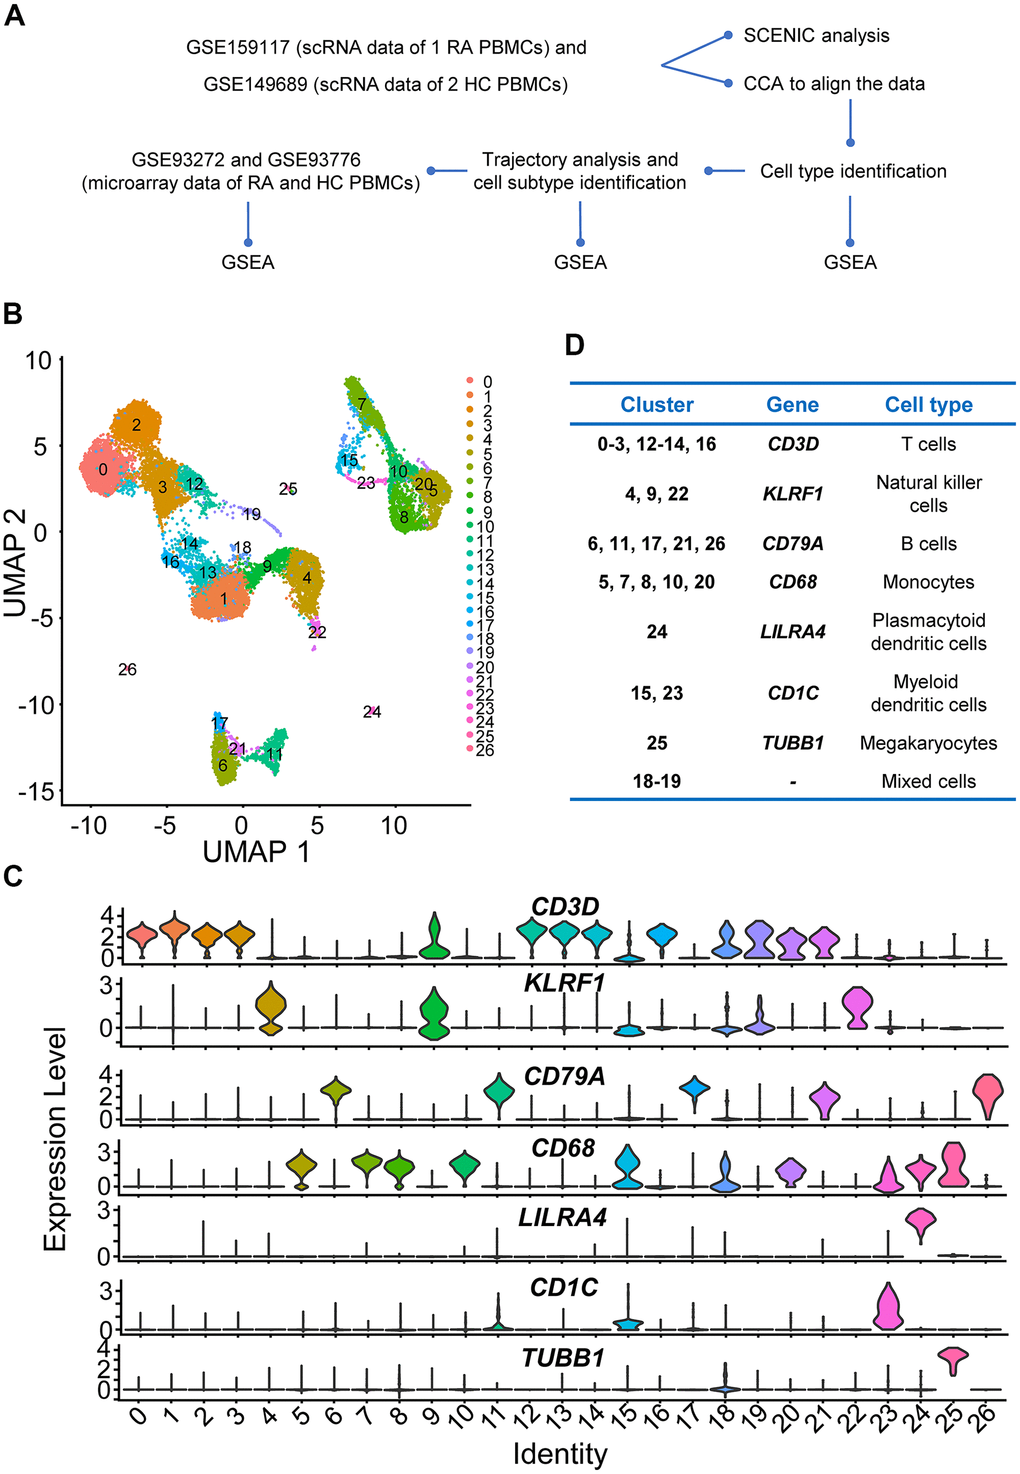
Figure 1.Study design and preliminary analysis. (A) Workflow of scRNA sequencing and microarray data analysis. Step 1: We first downloaded individual rheumatoid arthritis (RA) and healthy control (HC) peripheral blood mononuclear cell (PBMC) scRNA sequencing data (GSE159117 and GSE149689) from the Gene Expression Omnibus (GEO) database (https://www.ncbi.nlm.nih.gov/geo/). To eliminate the potential batch effects, canonical correlation analysis (CCA) was performed to integrate the two datasets. Afterwards, four main immune cell types (T cells, B cells, NK cells and monocytes) in PBMCs were identified. Then, we explored the up- and downregulated genes and gene sets using differential gene expression analysis and gene set enrichment analysis (GSEA). Subsequently, four main immune cell subtypes were identified using Monocle2, and up- and downregulated interferon (IFN)-related genes and gene sets in different immune cell subtypes were also identified. Step 2: Key transcription factors were identified, and gene regulatory networks (GRNs) were constructed using Single-Cell rEgulatory Network Inference and Clustering (SCENIC) analysis. Step 3: We downloaded microarray datasets including multiple RA and HC PBMC samples and explored the up- and downregulated IFN-related genes and gene sets. (B) Two-dimensional uniform manifold approximation and projection (UMAP) visualization of cell clusters. Cells were colored by clusters. (C) Violin plots of selected marker genes to identify cell classifications and their expression levels in each cell cluster. (D) The table of correspondence between cell clusters and cell types.
Figure 1 — A comprehensive transcriptomic analysis of alternate interferon signaling pathways in peripheral blood mononuclear cells in rheumatoid arthritis | Aging