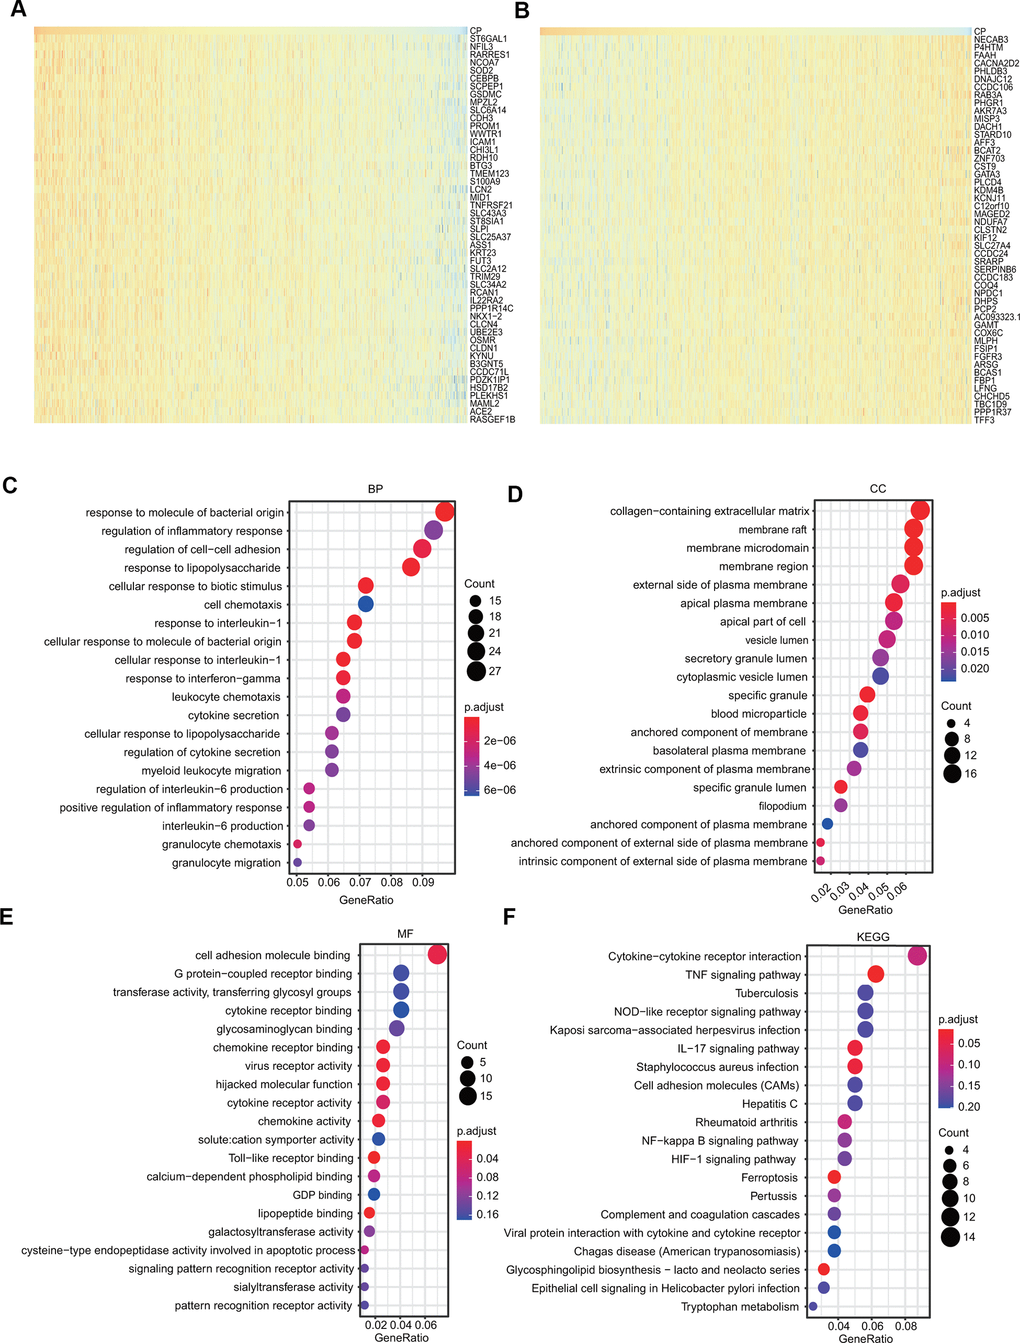
Figure 8.GO and KEGG analyses of ceruloplasmin in the TCGA-BRCA cohort. (A, B) Heat maps demonstrating the top 50 genes positively or negatively linked with ceruloplasmin in TCGA-BRCA. (C–E) Twenty significantly enriched GO annotations (BP, MF and CC) of ceruloplasmin in the TCGA-BRCA cohort. (F) Significantly enriched 20 KEGG pathways of ceruloplasmin in the TCGA-BRCA cohort.