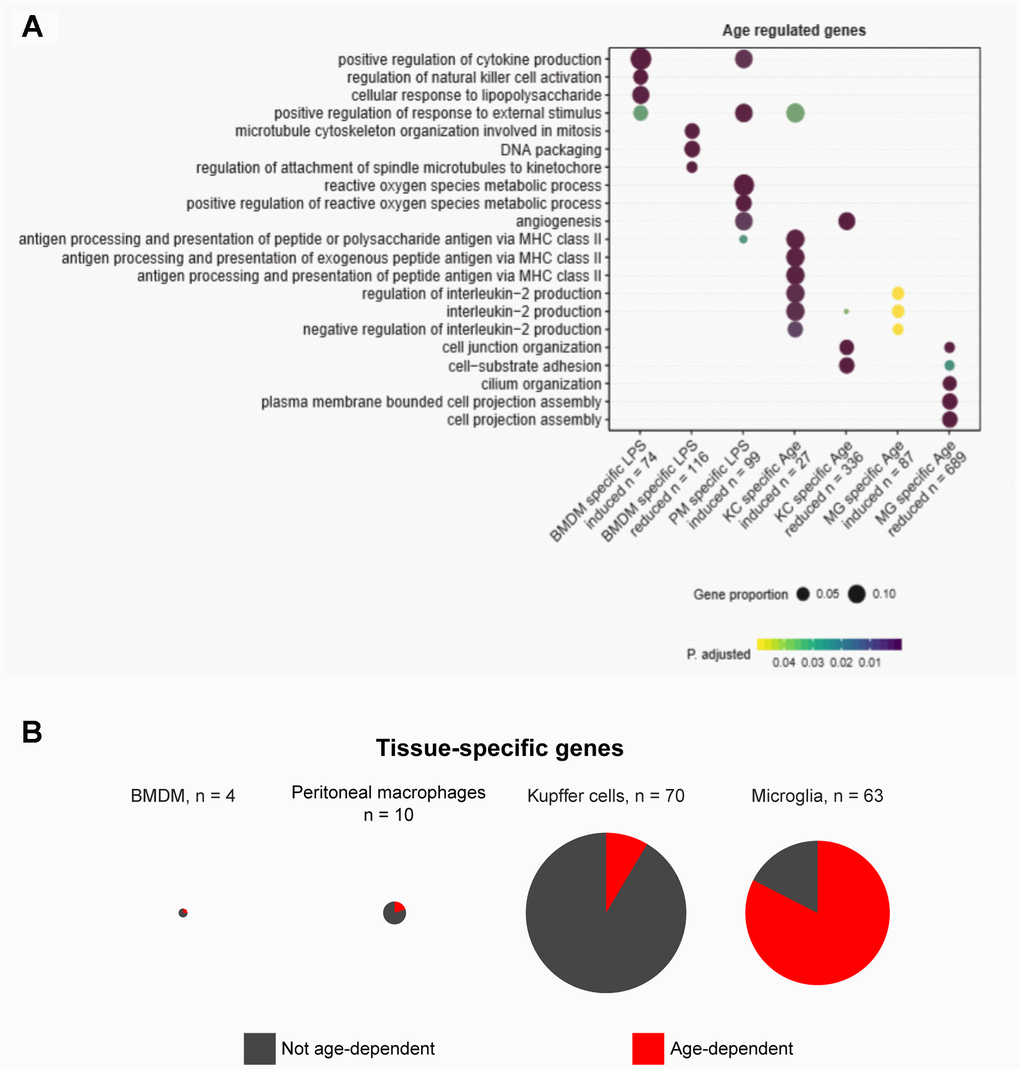
Figure 2.Gene ontology and tissue-specific gene expression signature analysis reveal diverse pathways in tissue homeostasis altered in aging. (A) Gene ontology analysis reveals pathways enriched among dysregulated genes in aging. (B) Pie charts show the proportions of tissue-specific genes unique to each macrophage type that are differentially expressed in aging.