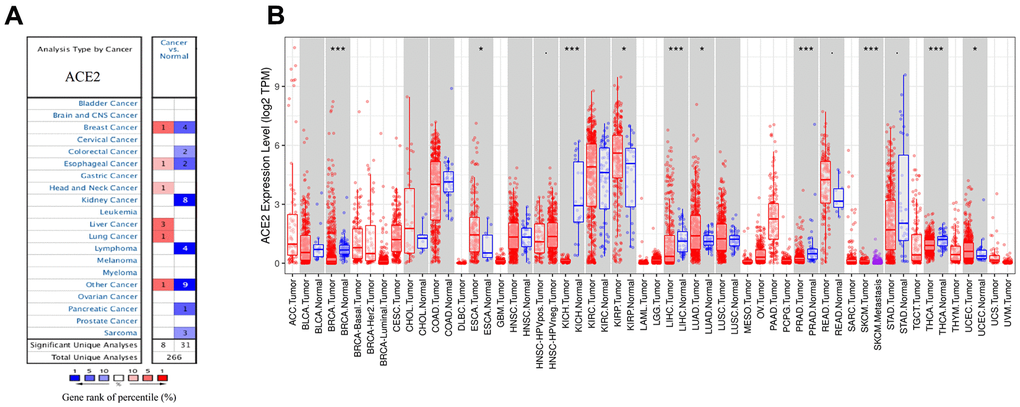
Figure 1.The expression levels of ACE2 in different cancers. (A) ACE2 in breast cancer compared to normal tissues in the Oncomine database. (B) ACE2 expression level of breast cancer and its different subtype in the TCGA database were detected by TIMER (*p<0.05, **p<0.01, ***p<0.001).