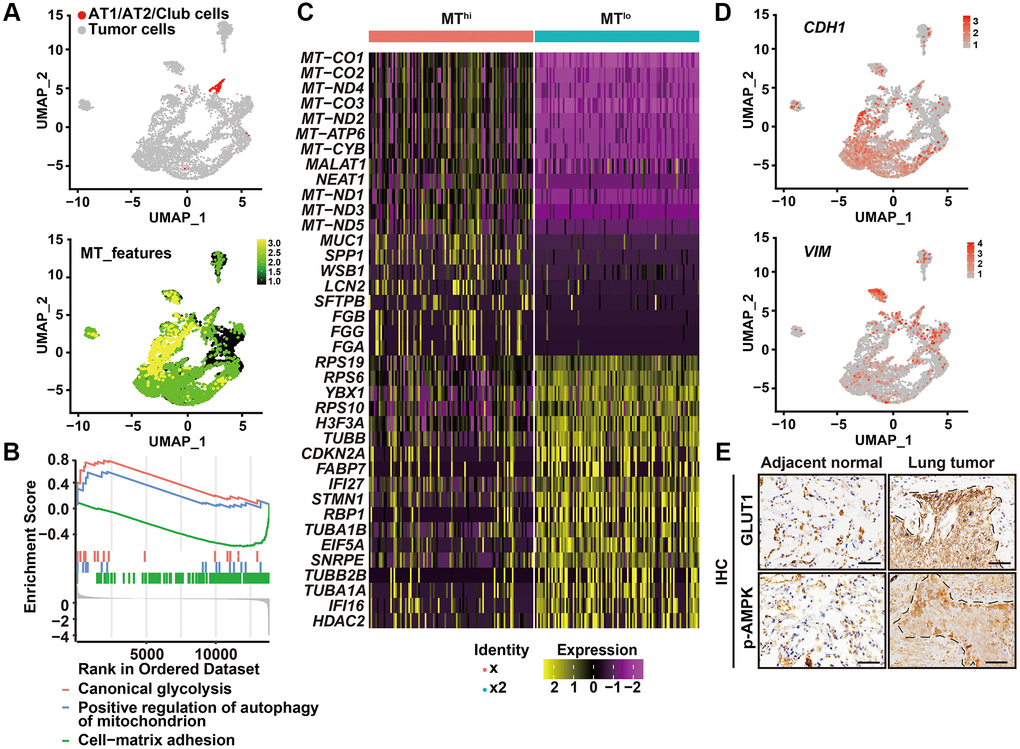
Figure 2.High autophagic cancer cells exhibited low MT-gene signature. (A) After removing the immune, endothelial and fibroblast cells, and re-clustering the remaining cells, predicted normal epithelial cell types, including AT1 (alveolar type I) cells, AT2 (alveolar type II) cells and club cells, based on gene expression were labeled (upper panel), and visualization of MT-gene signature scores (MT-ATP8, MT-ATP6, MT-CO1, MT-CO2, MT-CO3, MY-CYB, MT-ND1, MT-ND2, MT-ND3, MT-ND4, MT-ND4L, MT-ND5, MT-ND6) of malignant cells in 6 primary LUADs (lower panel). (B) GSEA analysis was performed to further screen the significant pathway between MTlo and MThi cancer cells. (C) Heatmap showing the expression level of the top 20 differentially expressed genes for MTlo and MThi clusters. (D) UMAP visualization of CDH1 and VIM of malignant cells in 6 primary LUADs. (E) IHC staining of phosphorylated AMPK (p-AMPK) and GLUT1 in tumor-adjacent tissue and LUSC tissue. Dashed line, tumor-stroma border. Scale bars, 50 μm.