Submit an Article
Navigate
Home
Editorial Board
Editorial Policies
Current Volume
Archive
Scientific Integrity
Publication Ethics Statements
Interviews with Outstanding Authors
Newsroom
Sponsored Conferences
Podcast
Contact
Special Collections
Submit an Article
Online ISSN: 1945-4589
Research Paper
|
Volume 13, Issue 17
|
pp. 21142–21154
Serglycin promotes proliferation, migration, and invasion via the JAK/STAT signaling pathway in osteosarcoma
Back to article
Figure 3
(3 of 8)
−
100%
+
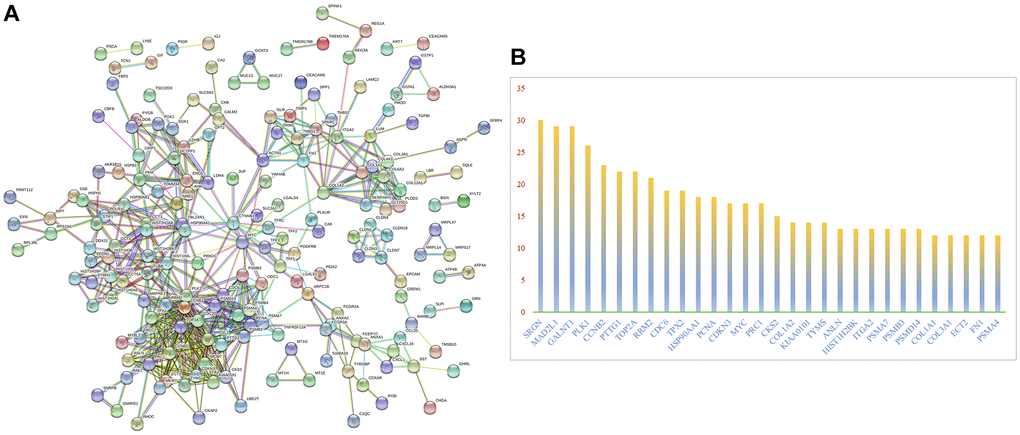
Figure 3.
PPI network analysis of differentially expressed mRNAs.
(
A
) PPI network analysis. (
B
) The frequency with which each core gene appears in the network diagram.