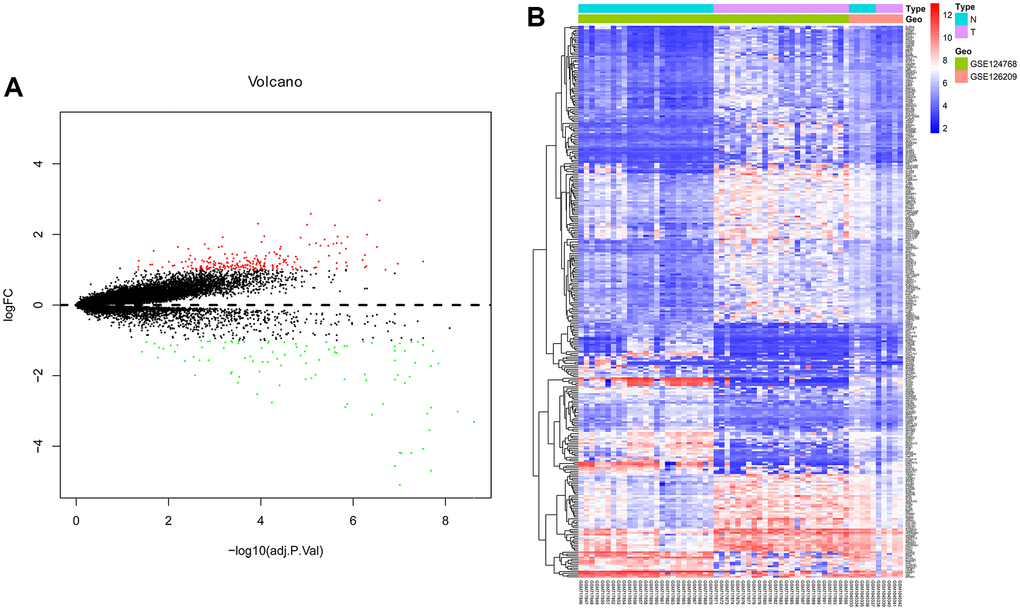
Figure 1.Differentially expressed genes analyzed by R software. (A) Volcano plot and (B) Heat map of differentially expressed genes. A: Red dots indicate up-regulated DEGs, green dots indicate down-regulated DEGs, black dots indicate non-differentially expressed DEGs. B: Red dots indicate up-regulated DEGs, blue dots indicate down-regulated DEGs, white dots indicate non-differentially expressed genes.