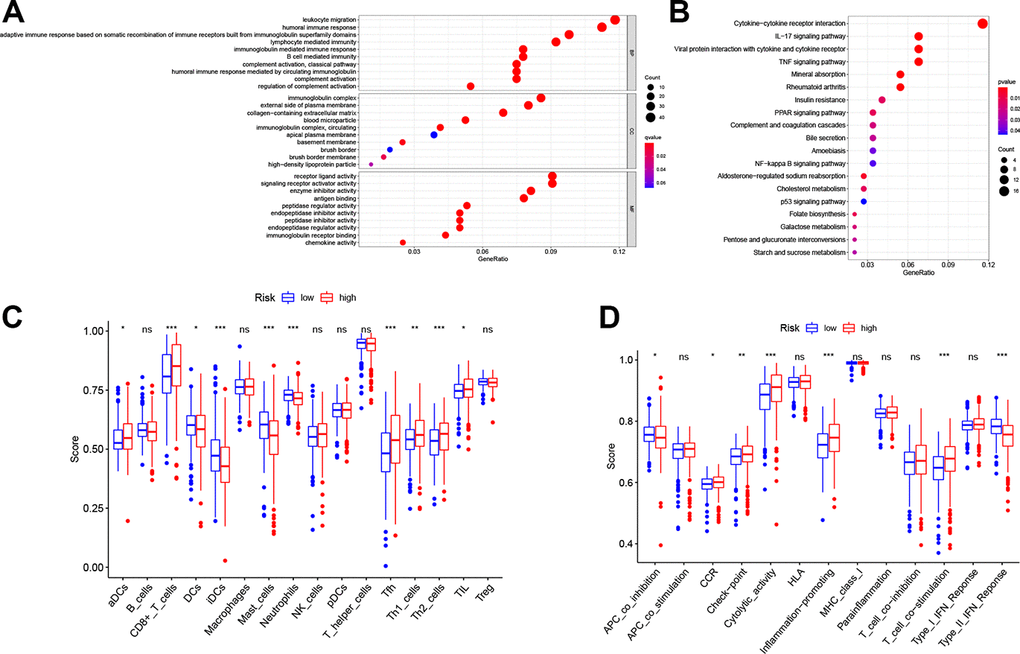
Figure 6.Functional analyses in the TCGA cohort. Representative results of the most significant GO enrichment (A) and KEGG pathways (B) in the TCGA cohort. ssGSEA scores of immune cells (C) and immune-related functions (D) between different risk groups. ns, not significant; *, P < 0.05; **, P < 0.01; ***, P < 0.001.