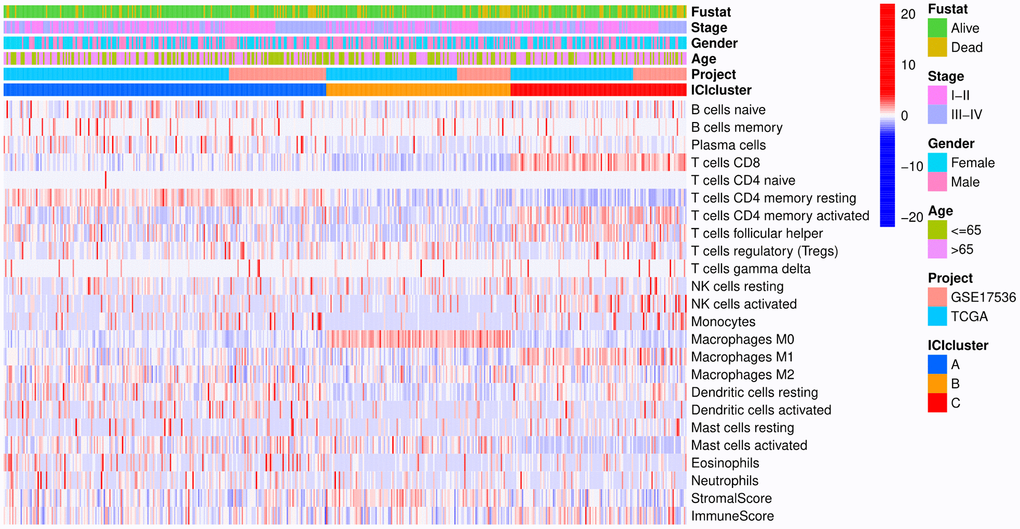
Figure 1.Heat map. Rows represent colon cancer samples, columns represent tumor-infiltrating immune cells, red indicates high expression, and blue indicates low expression.
Figure 1 — Immune cell infiltration-associated signature in colon cancer and its prognostic implications | Aging