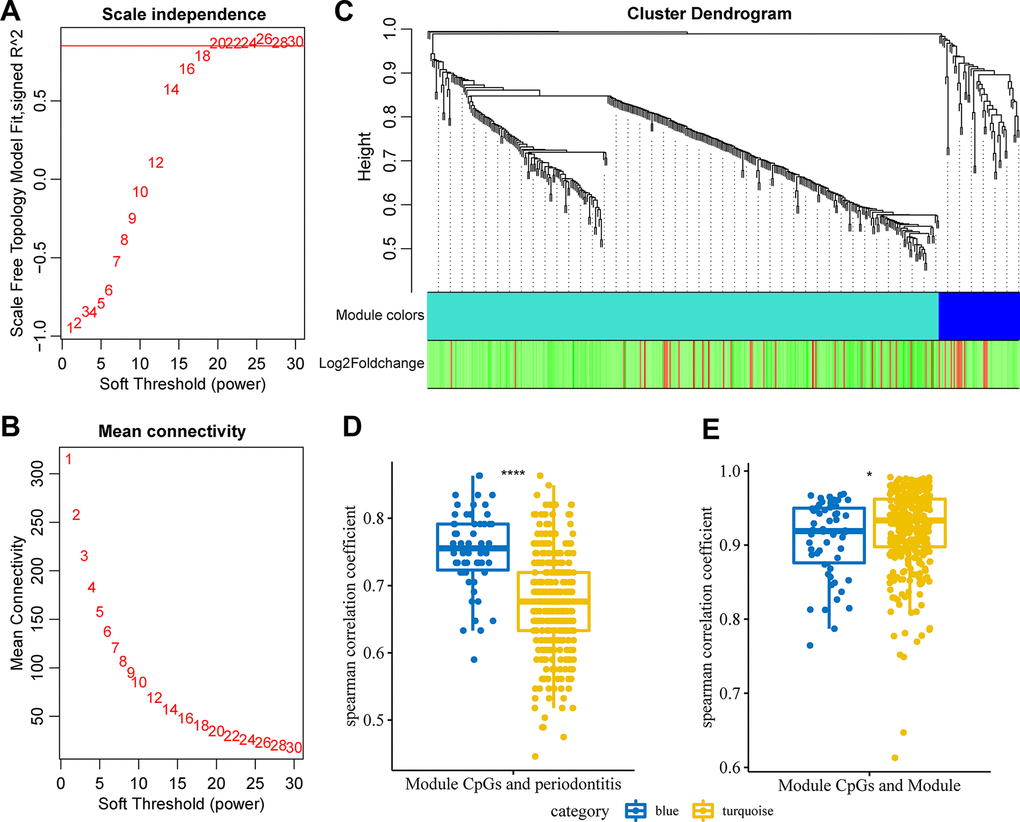
Figure 3.Weighted co-expression analysis identified immune-related co-expression of DMPs. (A) Analysis of the scale-free fit index for various soft-thresholding powers (β). (B) Analysis of the mean connectivity for various soft-thresholding powers. (C) Dendrogram of all differentially expressed genes clustered based on a dissimilarity measure (1-TOM). (D) The correlation distribution of CpG site methylation in the module and periodontitis. (E) The correlation distribution of CpG site methylation in the module and module.