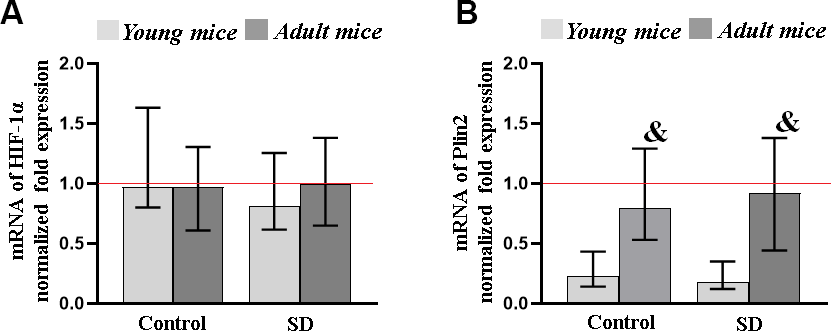
Figure 6.The level of transcription factor HIF-1α (A) and PLIN2 (B) genes expression in the mice brain after sleep deprivation modeling. Data are normalized to the reference gene (Oaz1), * - versus “SD young”, p≤0.05, the Kruskal-Wallis test.
Figure 6 — Features of age-related response to sleep deprivation: in vivo experimental studies | Aging