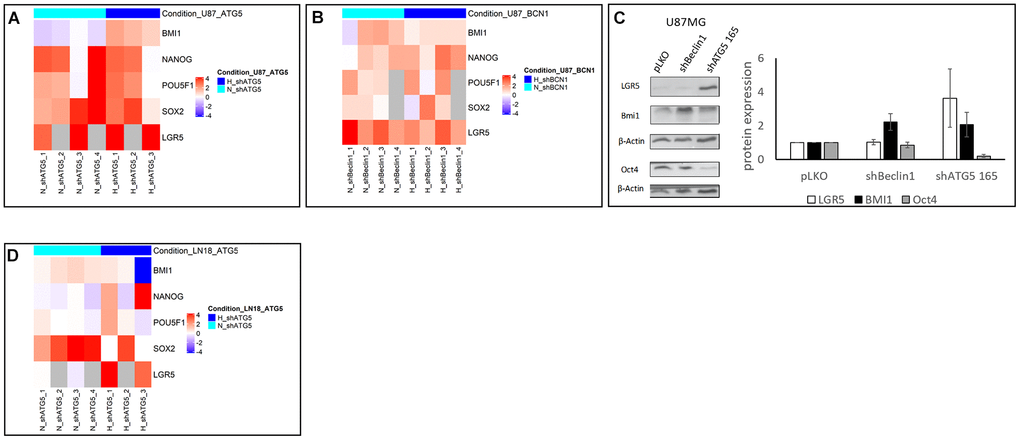
Figure 2.(A, B, D) Heatmap representation of stem cell markers in U87 and LN18 cell lines (N=3). Heatmap representation of stem cell markers expression level after extinction of Beclin 1 (BCN1) or ATG5 by RNA interference in normoxic (N, turquoise color) and hypoxic (H, blue color) conditions. Fold change has been calculated according to pLKO transfection with 2-ΔΔCt method, and log2 transformed. Inhibition of BCN1 (B) or ATG5 (A, D) by shRNA transfection has been performed in U87 (A, B) and LN18 (D) cell lines. Fold change was indicated in logarithmic scale by a blue to red color gradient (under- to over-expression in shRNA versus pLKO conditions). Grey color corresponds to missing samples. Heatmaps were generated in R environment, using Complex Heatmap package. (C) proteomic expression of cancer stem cells markers and quantification (N=3). Cancer stem cells markers expression increases in two cellular model after autophagy inhibition (shBeclin1 and shATG5).