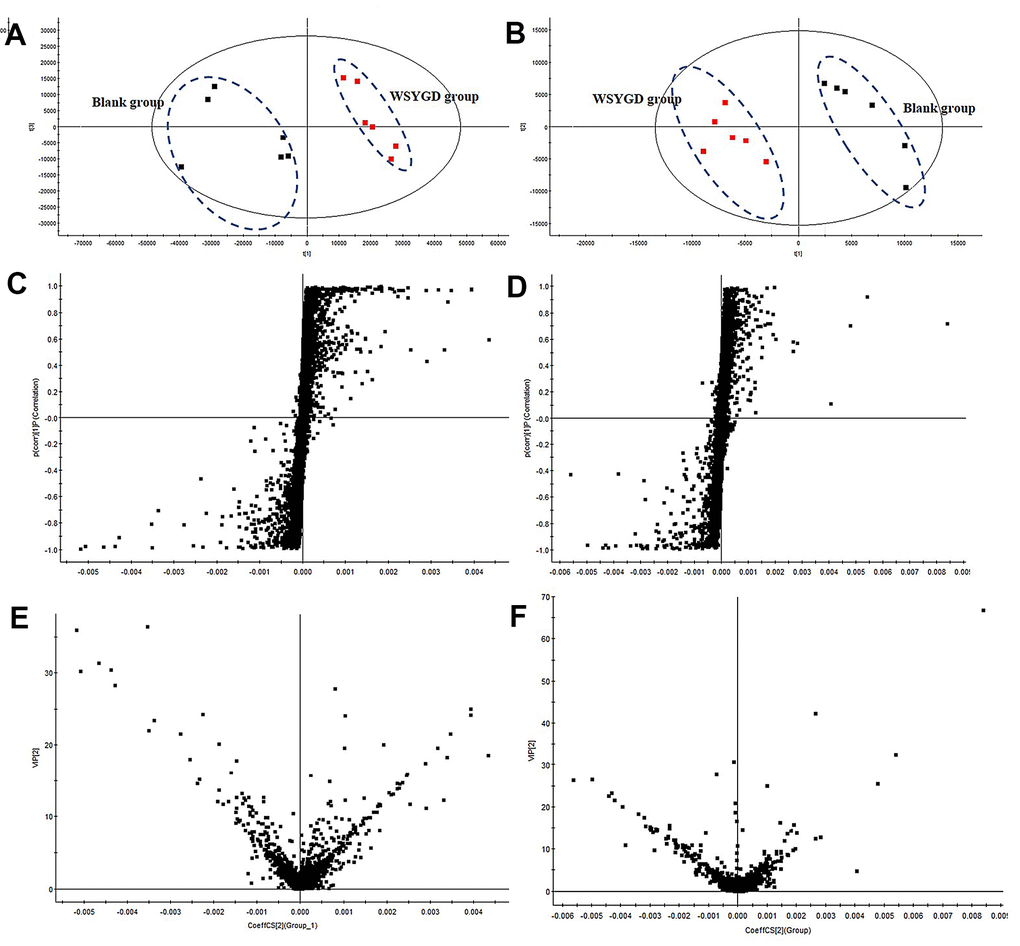
Figure 6.PCA score plot of all analyzed samples in positive-ion (A) mode and negative-ion (B) mode with the statistical parameters; S-plot of OPLS-DA in positive-ion (C) mode and negative-ion (D) mode with the statistical parameters; VIP value plot in positive-ion (E) mode and negative-ion (F) mode.