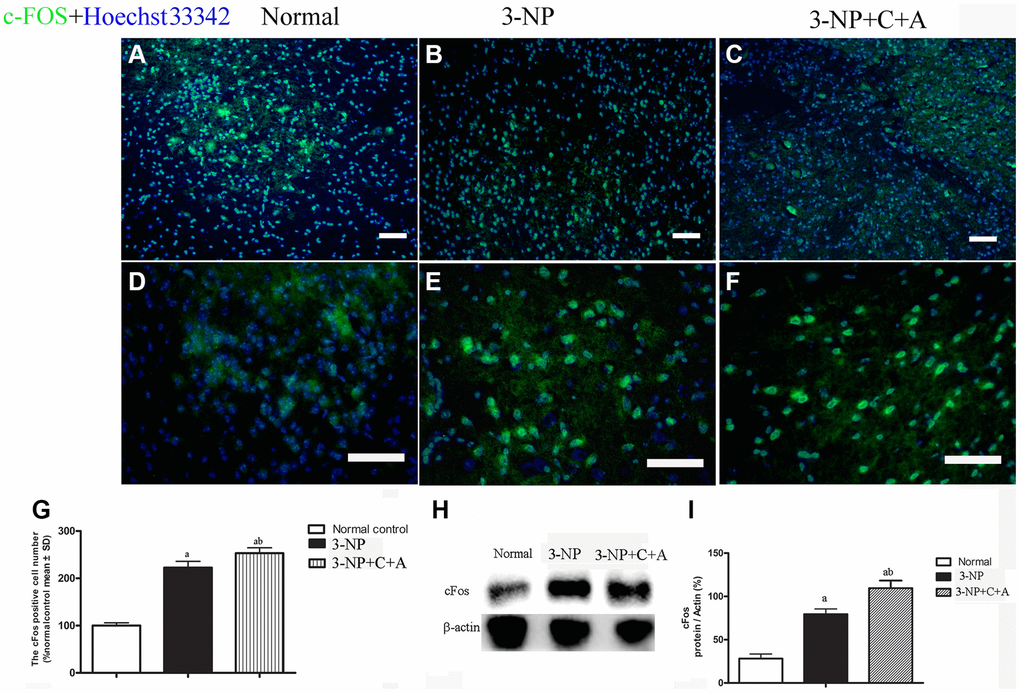
Figure 11.(A–G): Immunofluorescence staining images of c-FOS (green, immediate early gene, a marker of neuronal activation, (A–C) at magnification ×100 and (D–F) at magnification ×200. Cell nuclei were stained with Hoechst33342 dye (blue). (G) Semi-quantitative profiles showed elevated c-Fos expression in the 3-NP+vehicle group and a further increase in c-Fos levels with C16+Ang-1 treatment. Scale bar = 100 μm. Western blot images (H–I) of the levels of c-Fos in the control, 3-NP, and 3-NP+C16+Ang-1 groups showed a similar trend. aP < 0.05 versus control; bP < 0.05 versus 3-NP-treated mice.