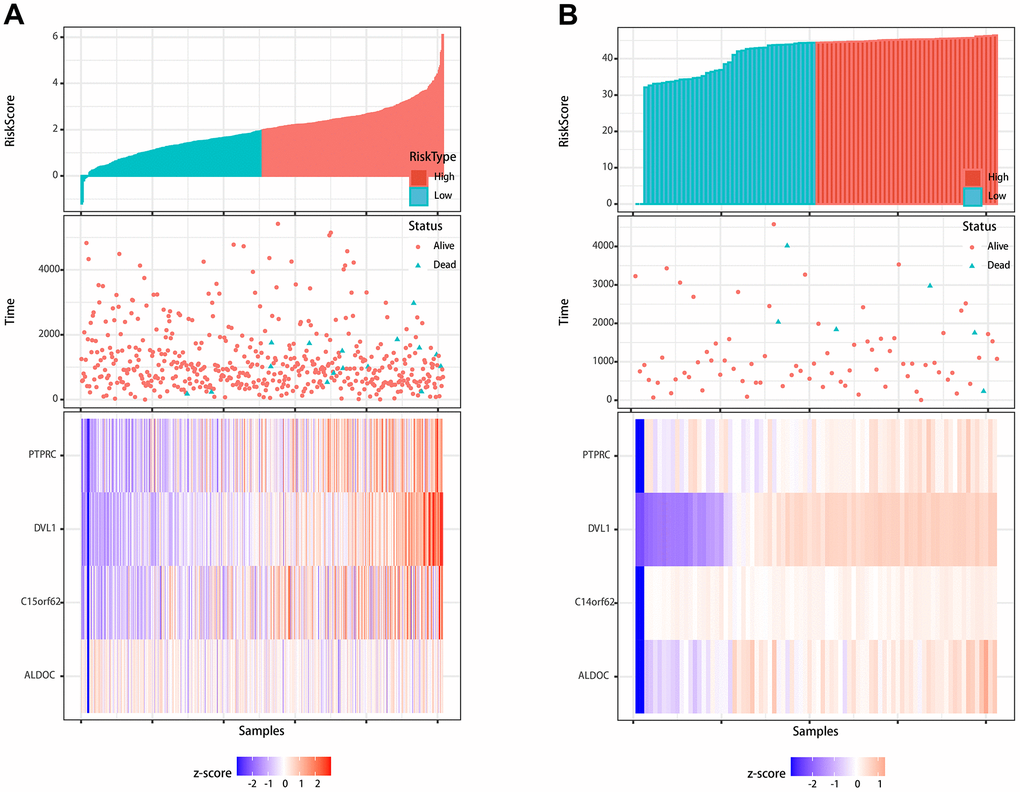
Figure 5.Visualization of the prognostic signature. (A) Visualization of the signature in the TCGA cohort. (B) Visualization of the signature in the validation cohort.
Figure 5 — Identification of 4-methylation driven genes based prognostic signature in thyroid cancer: an integrative analysis based on the methylmix algorithm | Aging