Submit an Article
Navigate
Home
Editorial Board
Editorial Policies
Current Volume
Archive
Scientific Integrity
Publication Ethics Statements
Interviews with Outstanding Authors
Newsroom
Sponsored Conferences
Podcast
Contact
Special Collections
Submit an Article
Online ISSN: 1945-4589
Research Paper
|
Volume 13, Issue 15
|
pp. 19352–19374
Identification of immune-related genes that predict prognosis and risk of bladder cancer: bioinformatics analysis of TCGA database
Back to article
Figure 2
(2 of 12)
−
100%
+
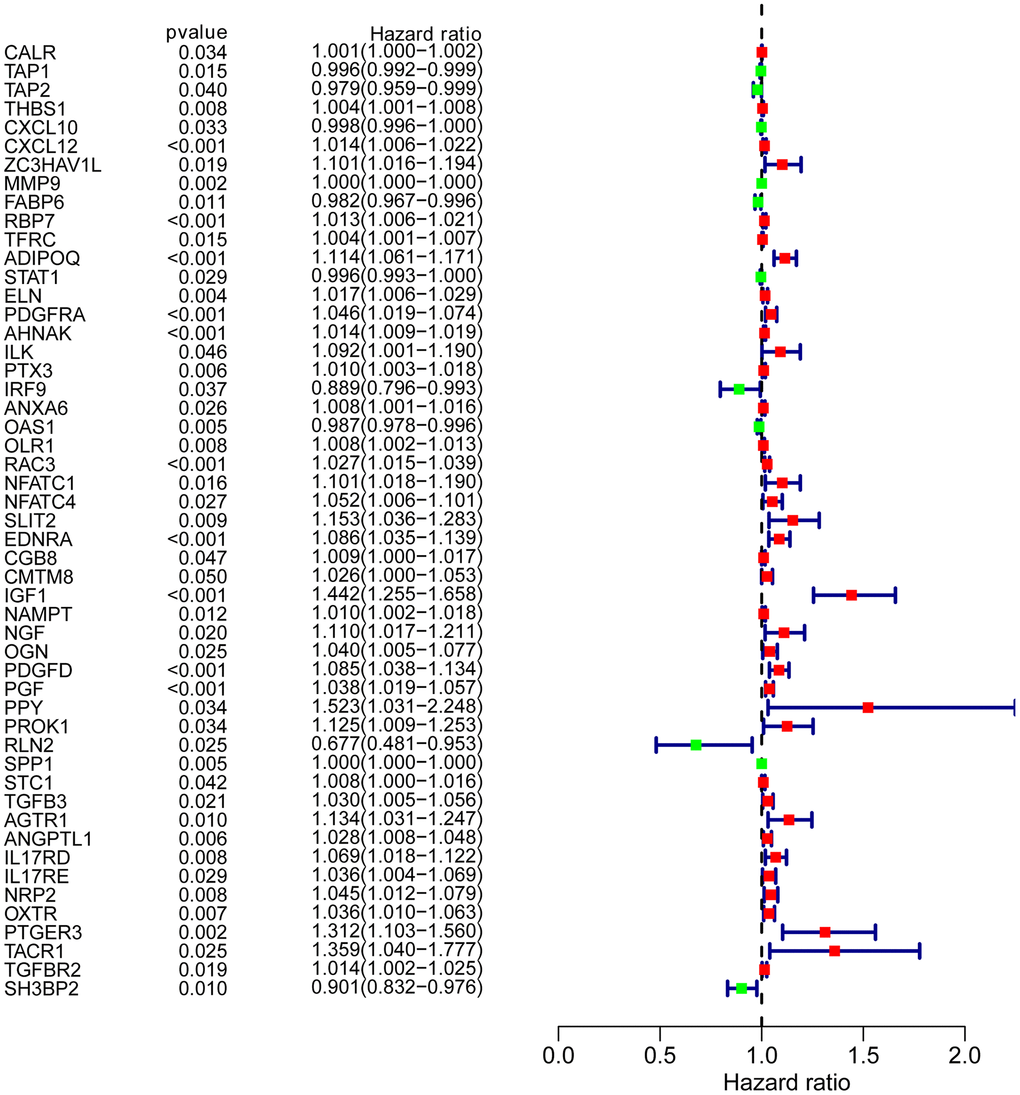
Figure 2.
Prognosis-associated DEIRGs.
Forest plot of hazard ratios showing the prognostic values of IRGs.