Submit an Article
Navigate
Home
Editorial Board
Editorial Policies
Current Volume
Archive
Scientific Integrity
Publication Ethics Statements
Interviews with Outstanding Authors
Newsroom
Sponsored Conferences
Podcast
Contact
Special Collections
Submit an Article
Online ISSN: 1945-4589
Research Paper
|
Volume 13, Issue 14
|
pp. 18645–18657
A nomogram for predicting late radiation-induced xerostomia among locoregionally advanced nasopharyngeal carcinoma in intensity modulated radiation therapy era
Back to article
Figure 1
(1 of 3)
−
100%
+
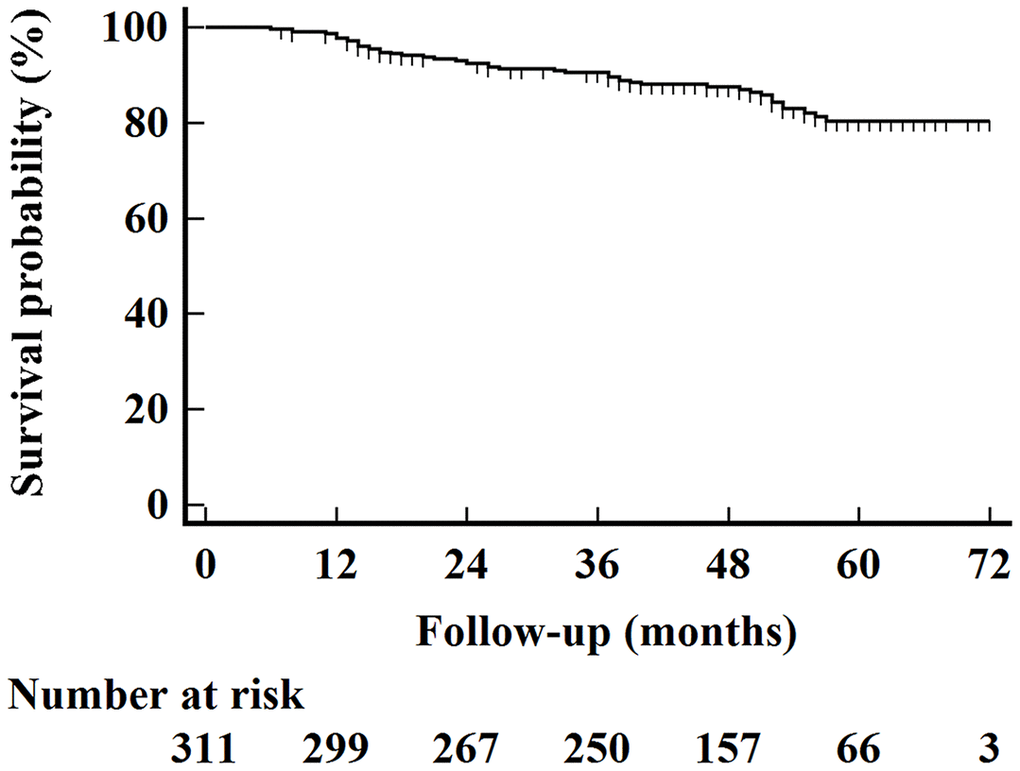
Figure 1.
Kaplan–Meier overall survival curves for all 311 patients.