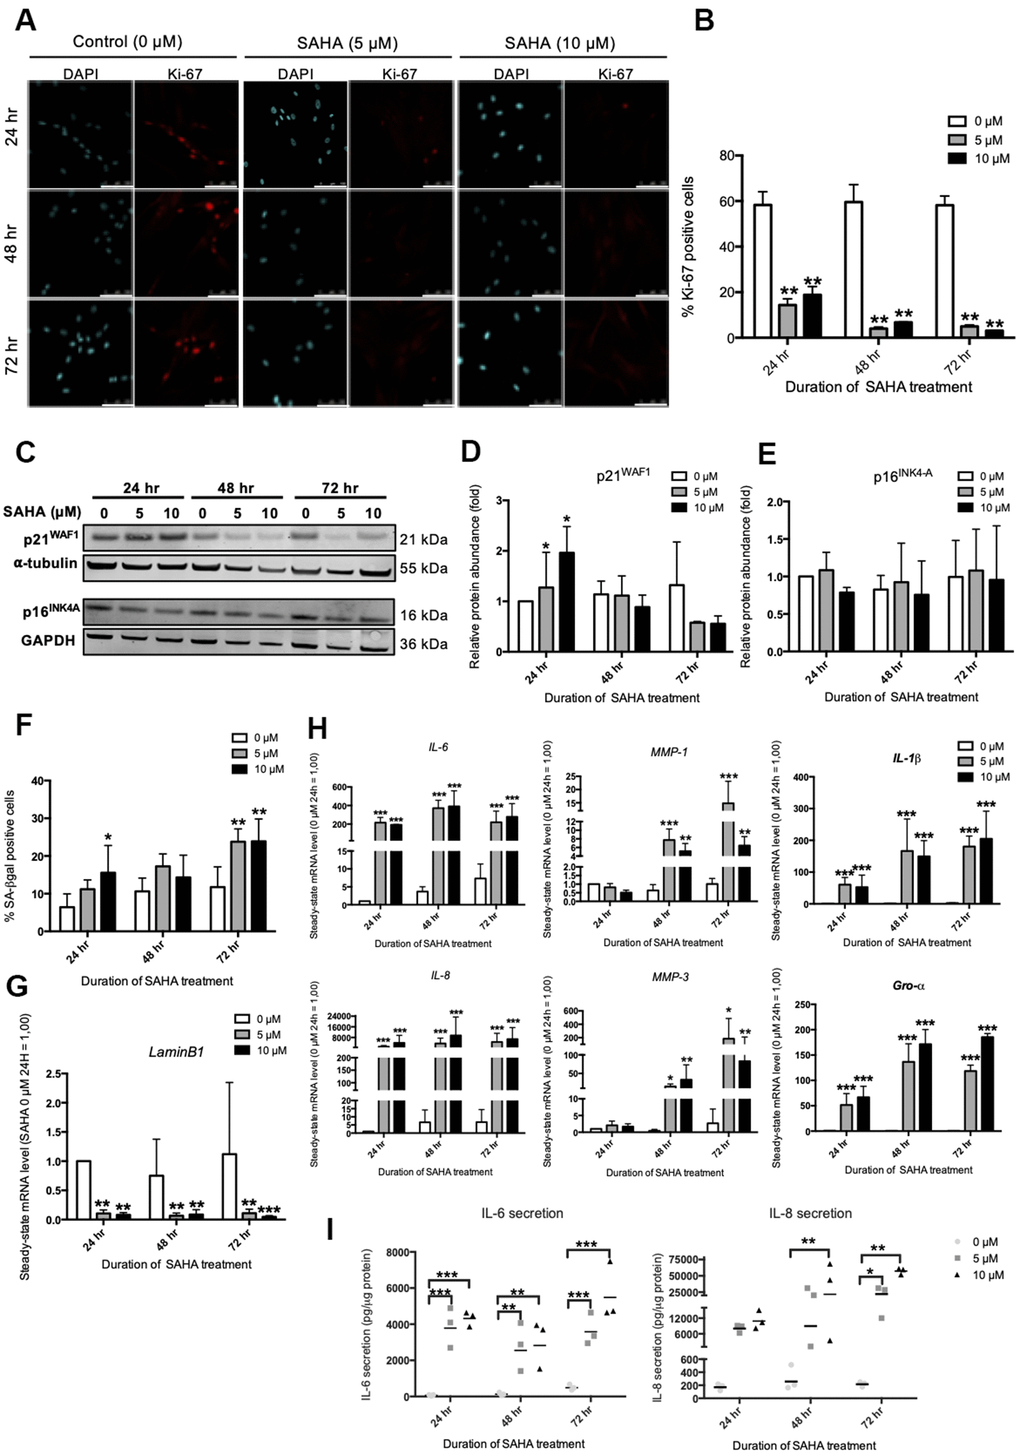
Figure 2.SAHA repeated treatment induces the appearance of senescence biomarkers in AG04431 cells. Cells at early passage were treated with 0, 5 or 10 μM of SAHA during 24, 48 or 72 hr. (A) Representative confocal images of cells labelled with Ki-67 staining (red) and DAPI (nucleus staining, blue) (scale bar = 50 μM). (B) Percentage of Ki-67-positive cells. (C) Representative Western blots showing p16INK-4a and p21WAF-1 protein level, with α-tubulin or GAPDH as loading control. (D, E) Quantifications of the relative protein level of p21WAF-1 (D) and p16INK-4a (E). Signal intensities were quantified and normalized according to the abundance of α-tubulin or GAPDH and were expressed relatively to the control condition (0 μM SAHA, 24 hr). (F) Percentage of SA-βgal positive cells. (G) Steady-state mRNA level of Lamin B1. GAPDH was used as a housekeeping gene. (H) Steady-state mRNA level of IL-6, IL-8, MMP-1, MMP-3, IL-1β and Gro-α. GAPDH was used as housekeeping gene. Results are normalized to the control condition (0 μM SAHA, 24 hr). (I) Secretion of IL-6 and IL-8 following SAHA treatment. Supernatants were collected at 24, 48 and 72 hr and the IL-6 and IL-8 secreted levels were monitored by ELISA. Statistical analyses were performed using an ANOVA II (*: p<0.05; **: p<0.01; ***: p<0.001).