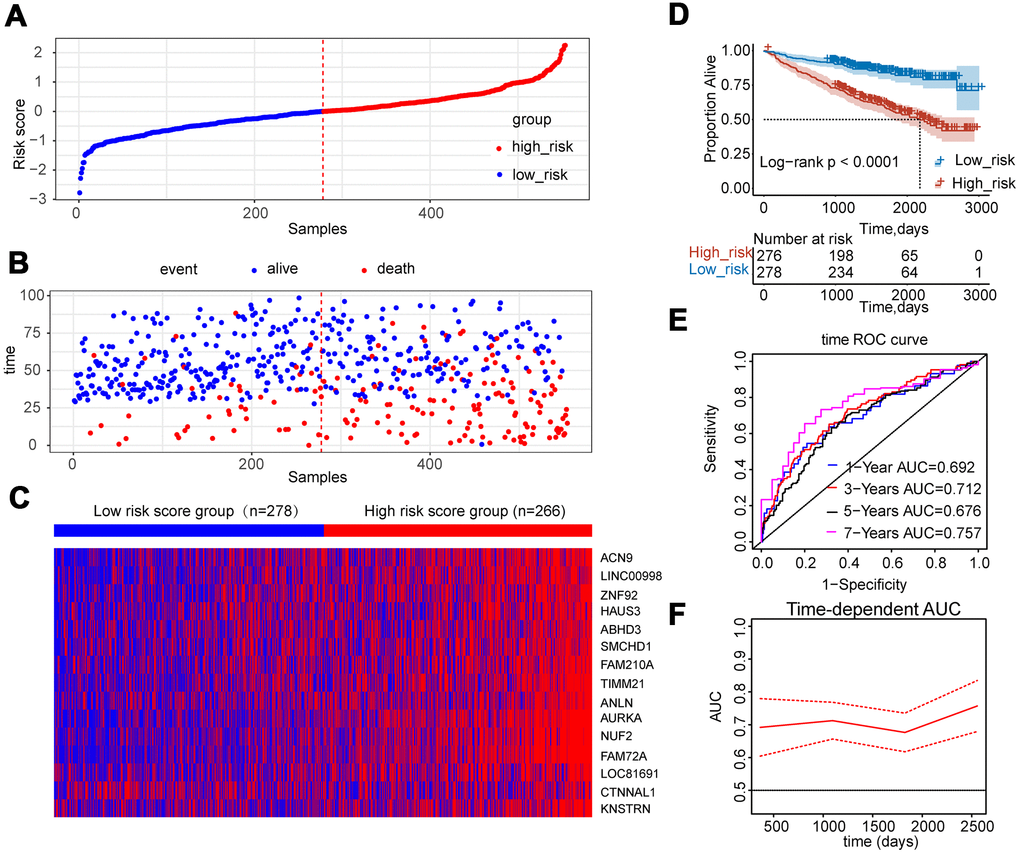
Figure 6.Construction of risk score model using the fifteen-gene expression profile in MM patients of GSE24080. (A) Fifteen-gene risk score distribution of MM patients based on risk score levels. The best cut-off value was used to divide the patients into two groups. (B) The survival status of all patients was distributed and classified by risk score group. (C) The expression profiles of the fifteen genes in high-risk and low-risk groups. (D) Kaplan-Meier analysis of the fifteen-gene risk score model. (E) Time-dependent ROC curves for the fifteen-gene risk score model to predict overall survival of MM patients. AUCs for 1 to 7-year survival were shown in the figure. (F) Time-dependent AUCs for the risk assessment model.