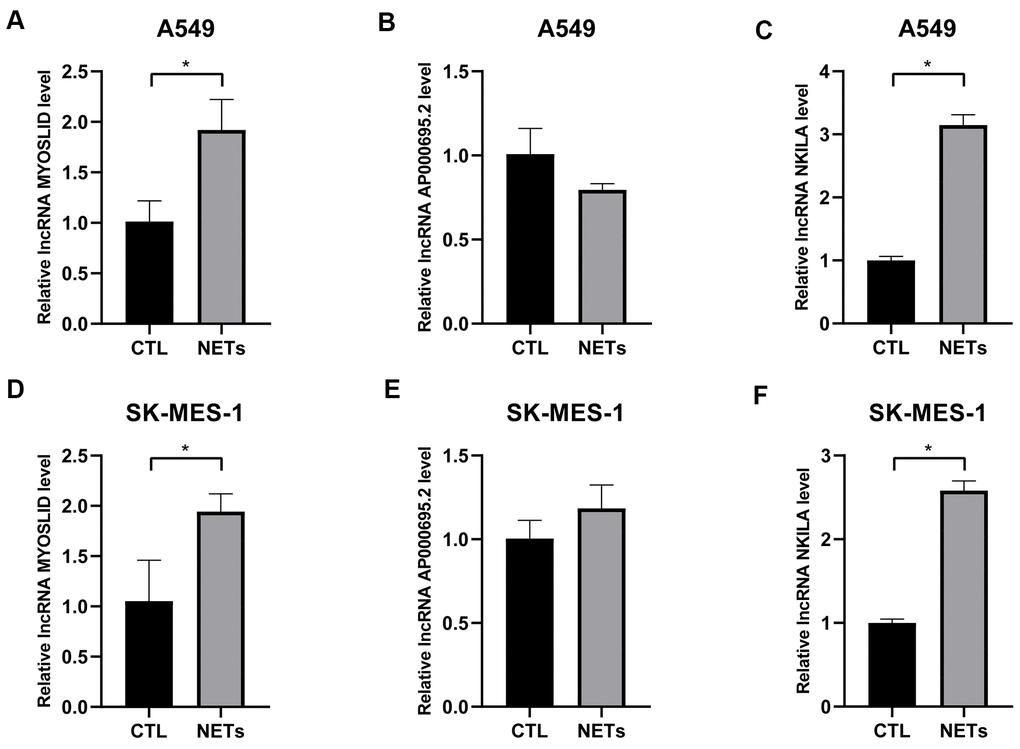
Figure 9.Validation of the expression levels of 3 adverse prognostic lncRNAs treated with NETs by RT-qPCR. (A–F) Expression levels of lncRNA AP000695.2, MYOSLID, and NKILA in NSCLC cells (A549, and SK-MES-1) treated with or without NETs for 12h, and presented as bar charts. *P < 0.05.