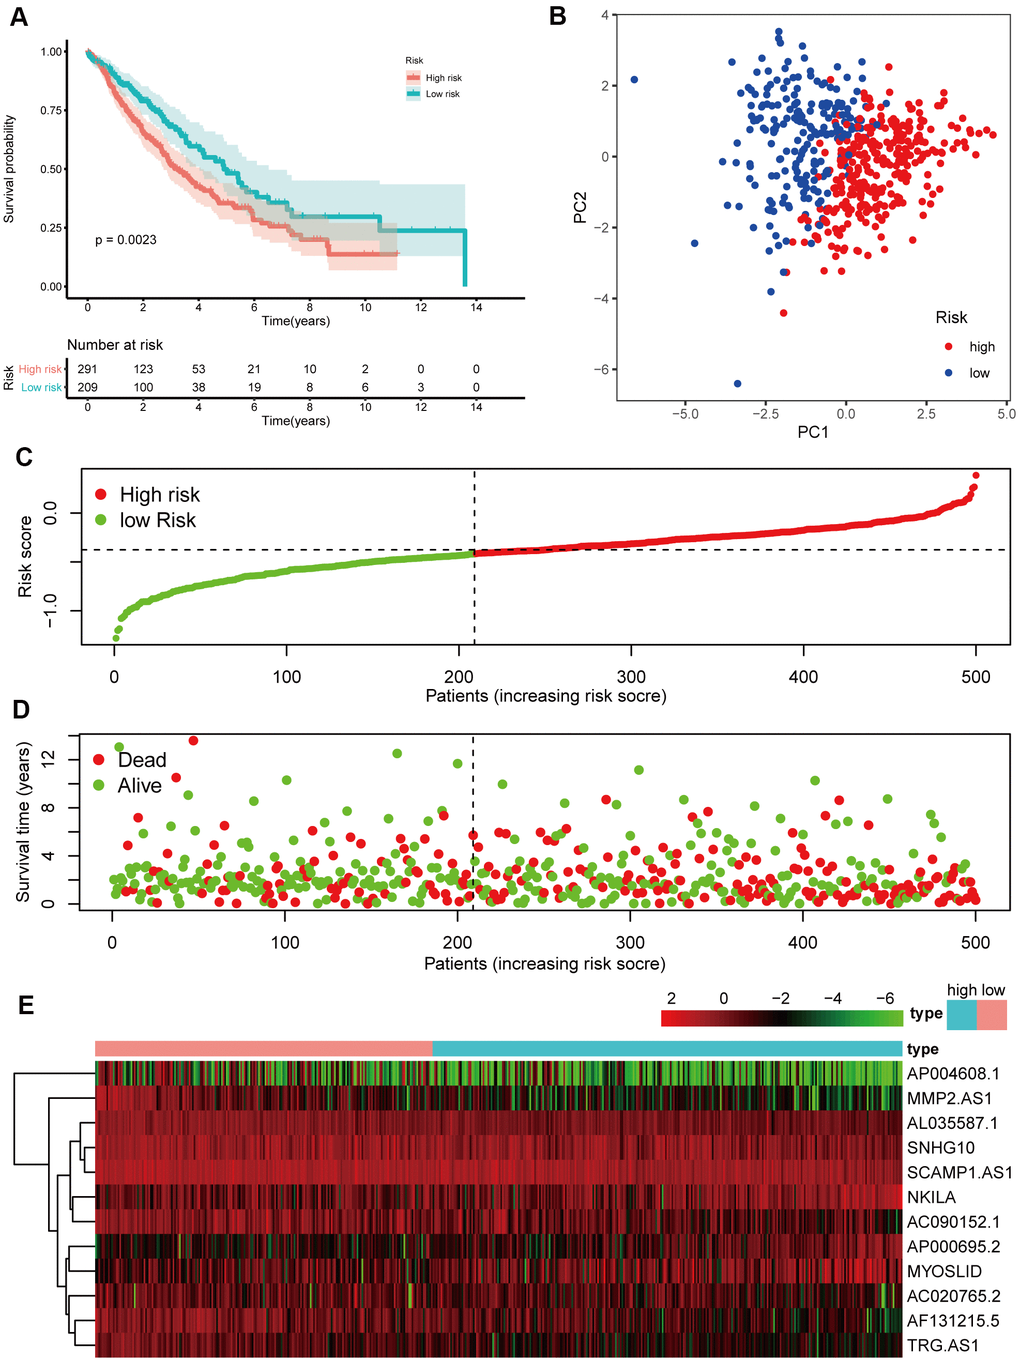
Figure 6.Prognostic analyses of the validation cohort. (A) Kaplan–Meier survival analysis. (B) PCA plot. (C) The risk scores in the different groups. (D) The survival time in the training cohort. (E) Heatmap of the expression levels of the 12 lncRNAs related to OS.