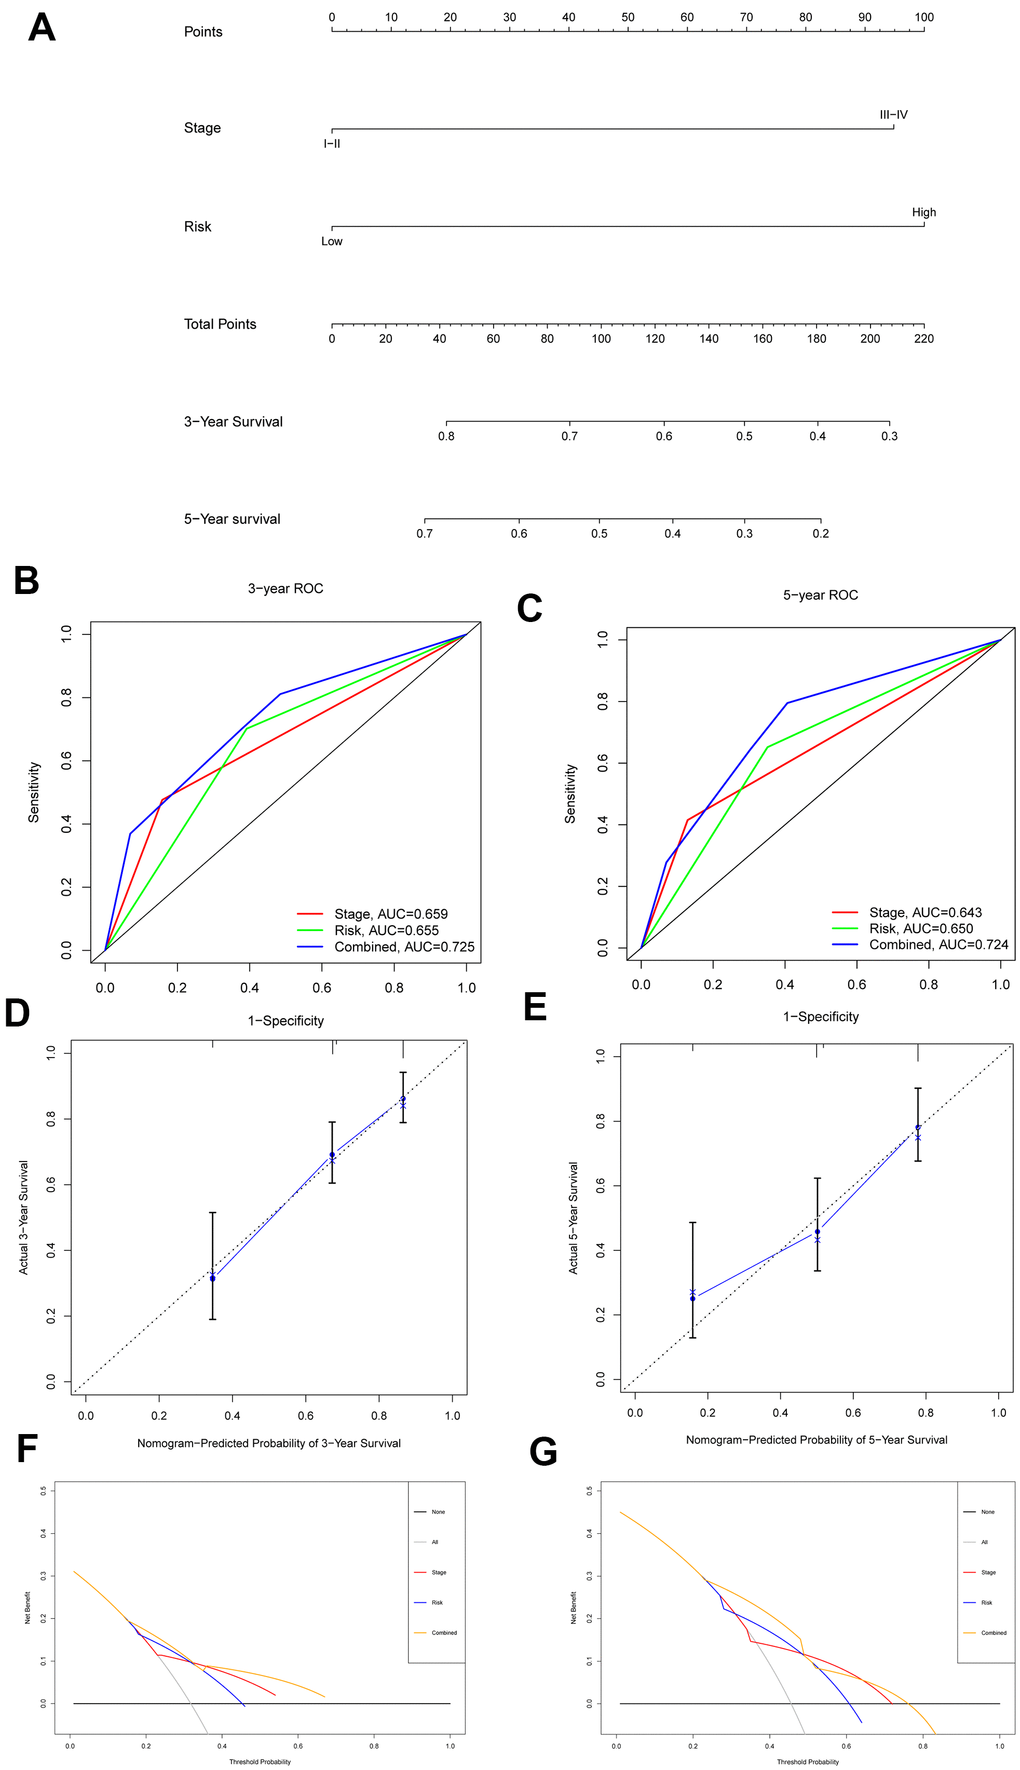
Figure 8.Nomogram to predict 3- and 5- year OS and its validation in HCC patients. (A) Nomogram to predict 3- and 5- year OS of HCC patients. (B, C) ROC curves to assess the accuracy of nomogram to predict 3- and 5- year OS in HCC patients. (D, E) Calibration plot analysis to assess the accuracy of nomogram to predict 3- and 5- year OS in HCC patients. (F, G) DCA to assess the accuracy of nomogram to predict 3- and 5- year OS in HCC patients.