Submit an Article
Navigate
Home
Editorial Board
Editorial Policies
Current Volume
Archive
Scientific Integrity
Publication Ethics Statements
Interviews with Outstanding Authors
Newsroom
Sponsored Conferences
Podcast
Contact
Special Collections
Submit an Article
Online ISSN: 1945-4589
Research Paper
|
Volume 13, Issue 13
|
pp. 17847–17863
Prognostic value of fatty acid metabolism-related genes in patients with hepatocellular carcinoma
Back to article
Figure 6
(6 of 11)
−
100%
+
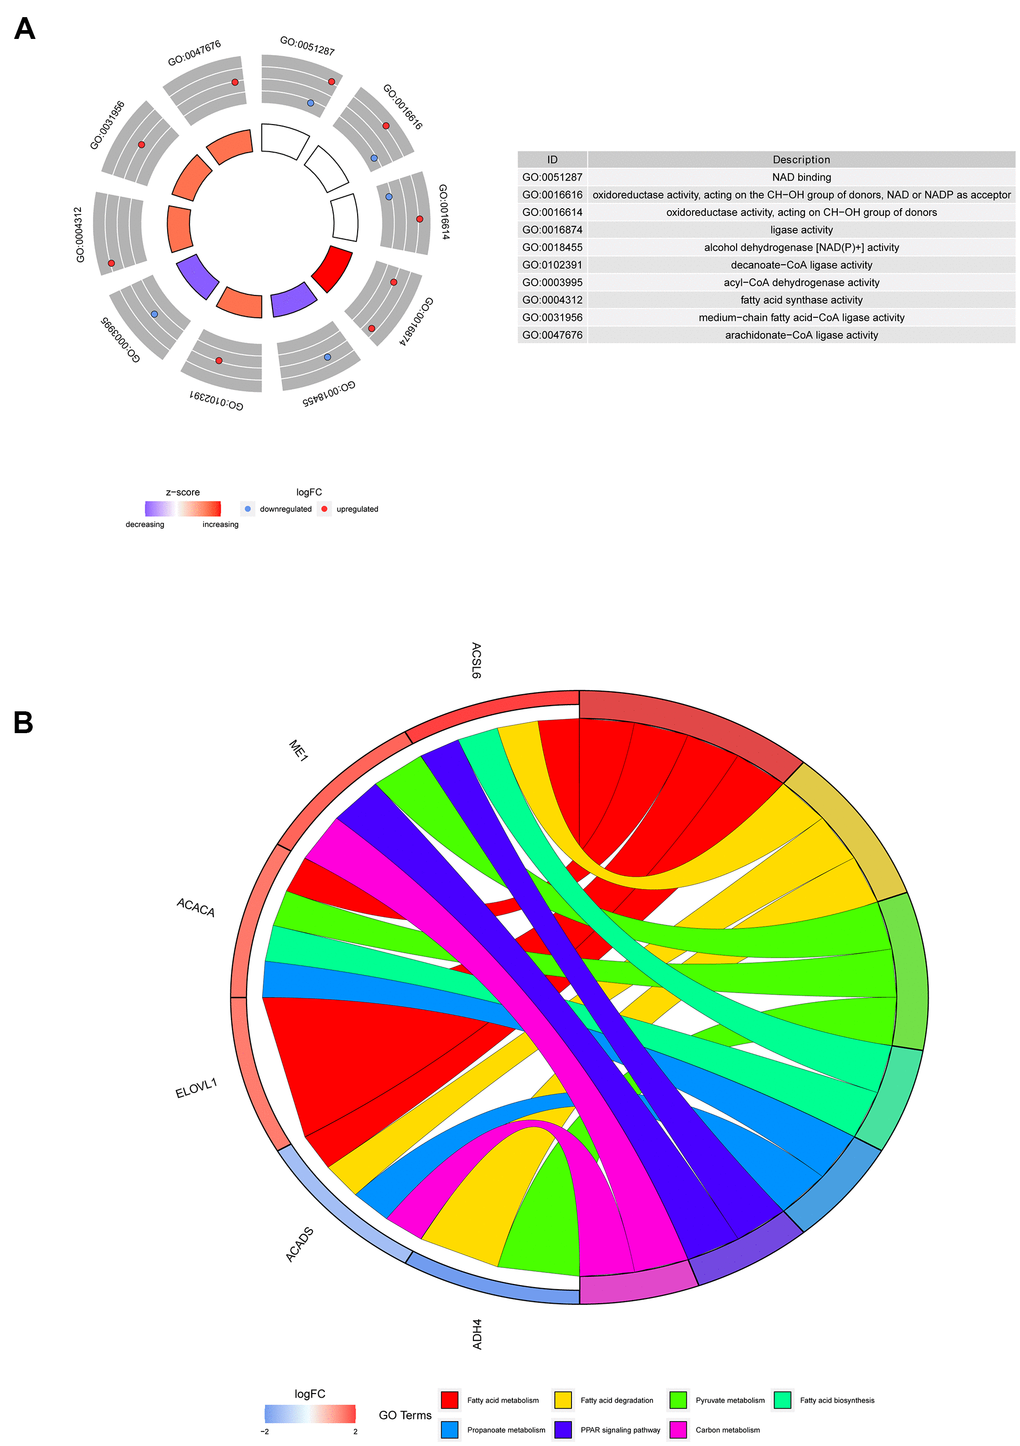
Figure 6.
Representative results of GO and KEGG analyses.
(
A
) The molecular functions of the 6 screened genes. (
B
) The potential biological pathways of the screened genes.