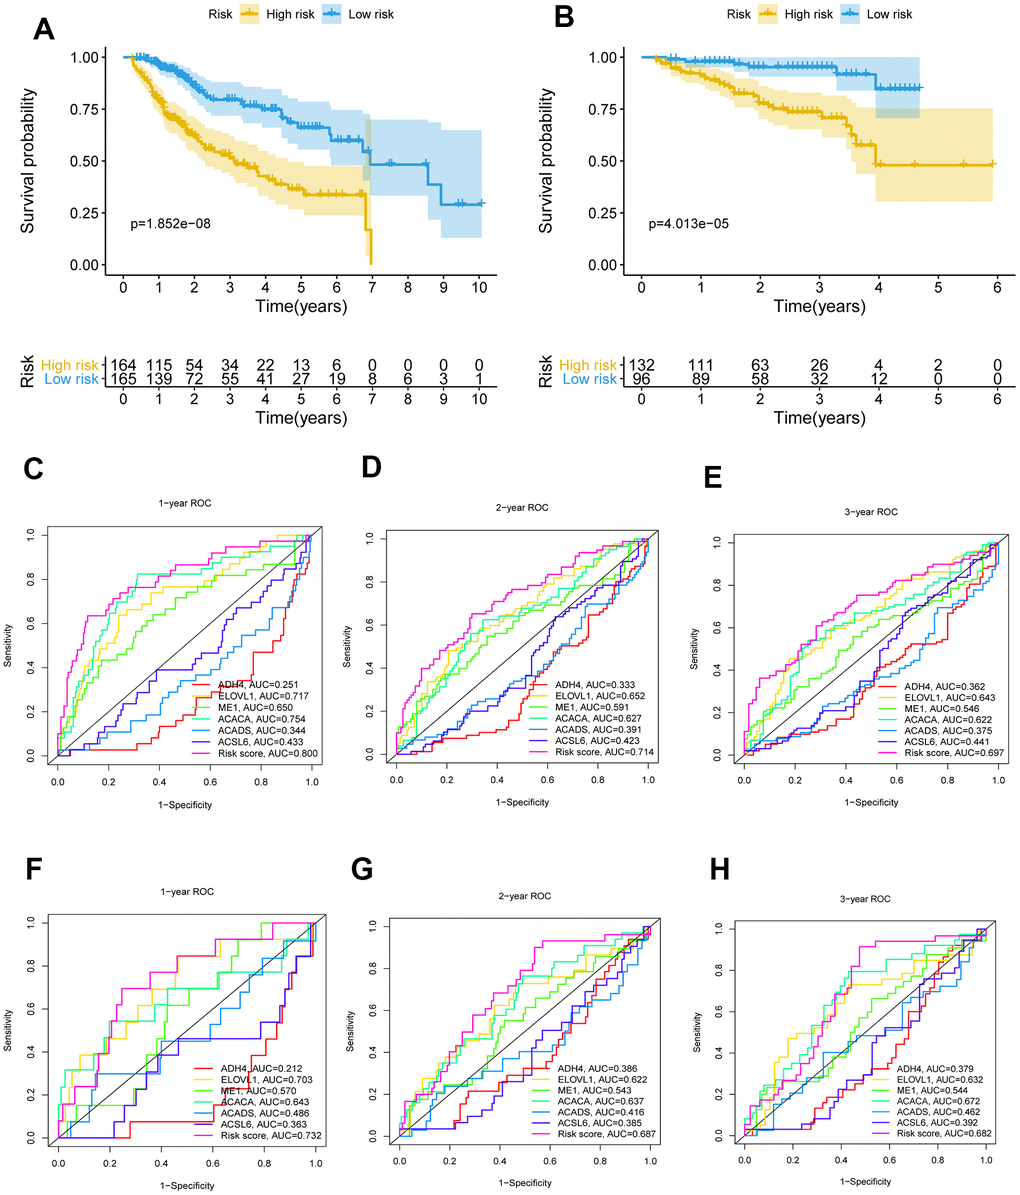
Figure 4.K-M survival analysis and ROC curves of risk prognostic model in HCC patients. (A, B) K-M survival analysis of risk prognostic model of HCC patients in TCGA and ICGC. (C–E) ROC curves analysis of risk prognostic model of HCC patients at 1 year, 2 years and 3 year in TCGA. (F–H) ROC curves analysis of risk prognostic model of HCC patients at 1 year, 2 years and 3 year in ICGC.