Submit an Article
Navigate
Home
Editorial Board
Editorial Policies
Current Volume
Archive
Scientific Integrity
Publication Ethics Statements
Interviews with Outstanding Authors
Newsroom
Sponsored Conferences
Podcast
Contact
Special Collections
Submit an Article
Online ISSN: 1945-4589
Research Paper
|
Volume 13, Issue 13
|
pp. 17818–17829
Particulate matter exposure is highly correlated to pediatric asthma exacerbation
Back to article
Figure 1
(1 of 5)
−
100%
+
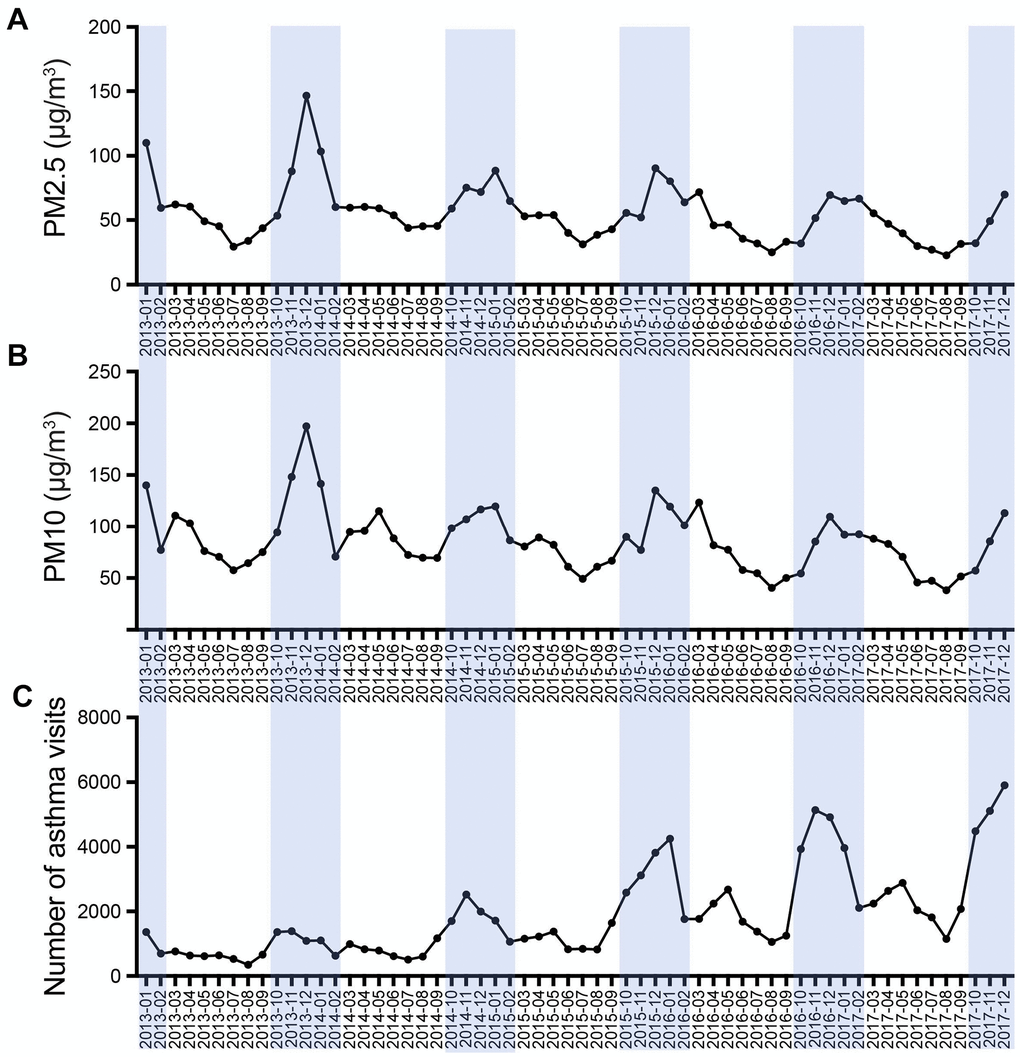
Figure 1.
Temporal pattern of monthly average PM concentration (
A
,
B
) and asthma visits (
C
) during January 2013 to December 2017.