Submit an Article
Navigate
Home
Editorial Board
Editorial Policies
Current Volume
Archive
Scientific Integrity
Publication Ethics Statements
Interviews with Outstanding Authors
Newsroom
Sponsored Conferences
Podcast
Contact
Special Collections
Submit an Article
Online ISSN: 1945-4589
Research Paper
|
Volume 13, Issue 14
|
pp. 18287–18297
Albiflorin alleviates cognitive dysfunction in STZ-induced rats
Back to article
Figure 1
(1 of 10)
−
100%
+
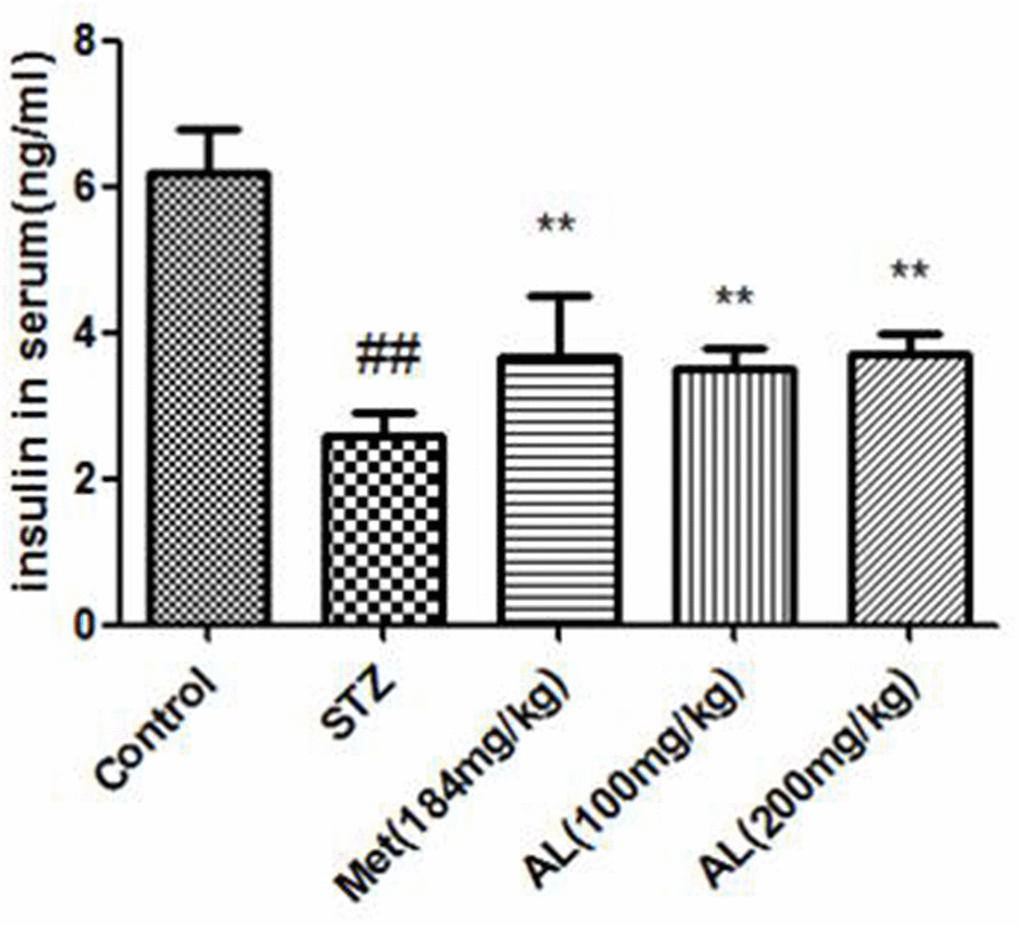
Figure 1.
AL decreased serum insulin level in rats.
Values are expressed as means±SDs. Compared with control:
#
P<0.05,
##
P<0.01; Compared with model:*P<0.05, **P<0.01.
Figure 1 — Albiflorin alleviates cognitive dysfunction in STZ-induced rats | Aging