Submit an Article
Navigate
Home
Editorial Board
Editorial Policies
Current Volume
Archive
Scientific Integrity
Publication Ethics Statements
Interviews with Outstanding Authors
Newsroom
Sponsored Conferences
Podcast
Contact
Special Collections
Submit an Article
Online ISSN: 1945-4589
Research Paper
|
Volume 13, Issue 13
|
pp. 17789–17817
Bioinformatics analysis of the role of CXC ligands in the microenvironment of head and neck tumor
Back to article
Figure 4
(4 of 11)
−
100%
+
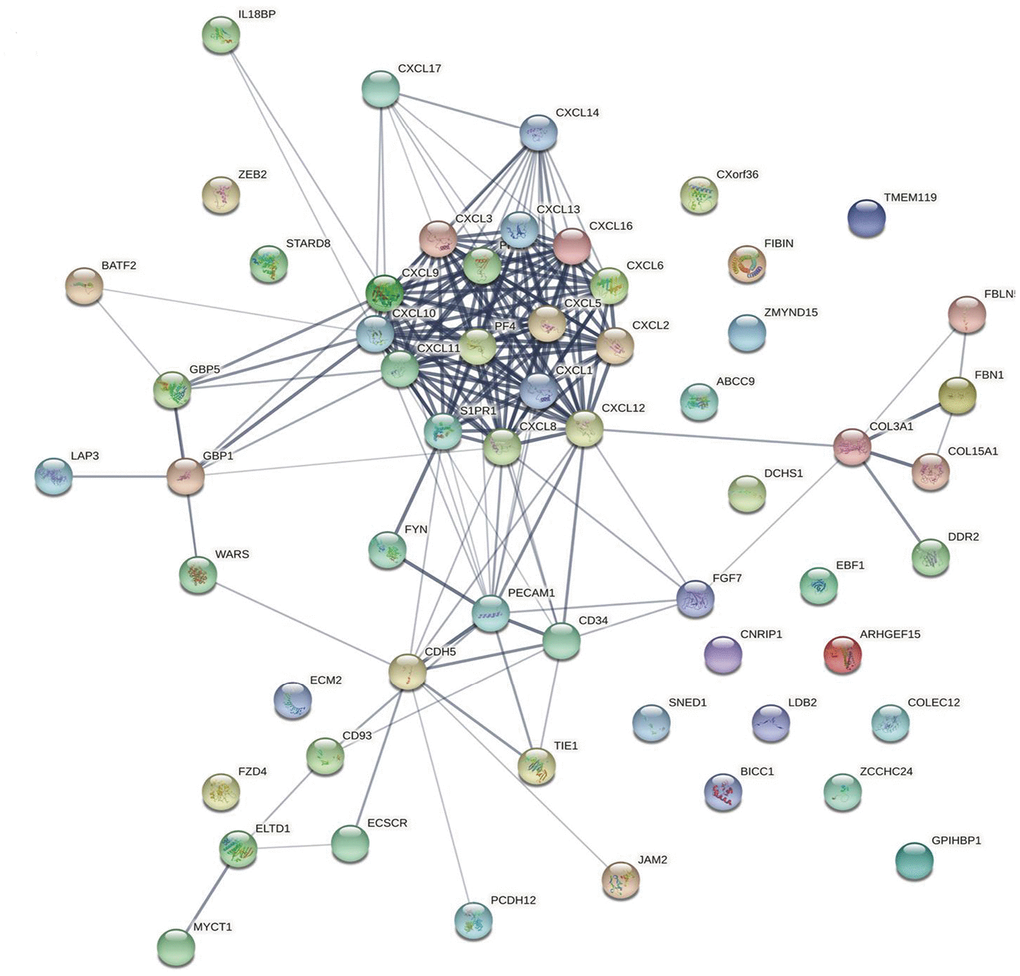
Figure 4.
Protein–protein interaction network.
The relationships between CXCLs and the top 50 similar genes were visualized using the STRING database (see
Supplementary Table 3
for a detailed gene list).