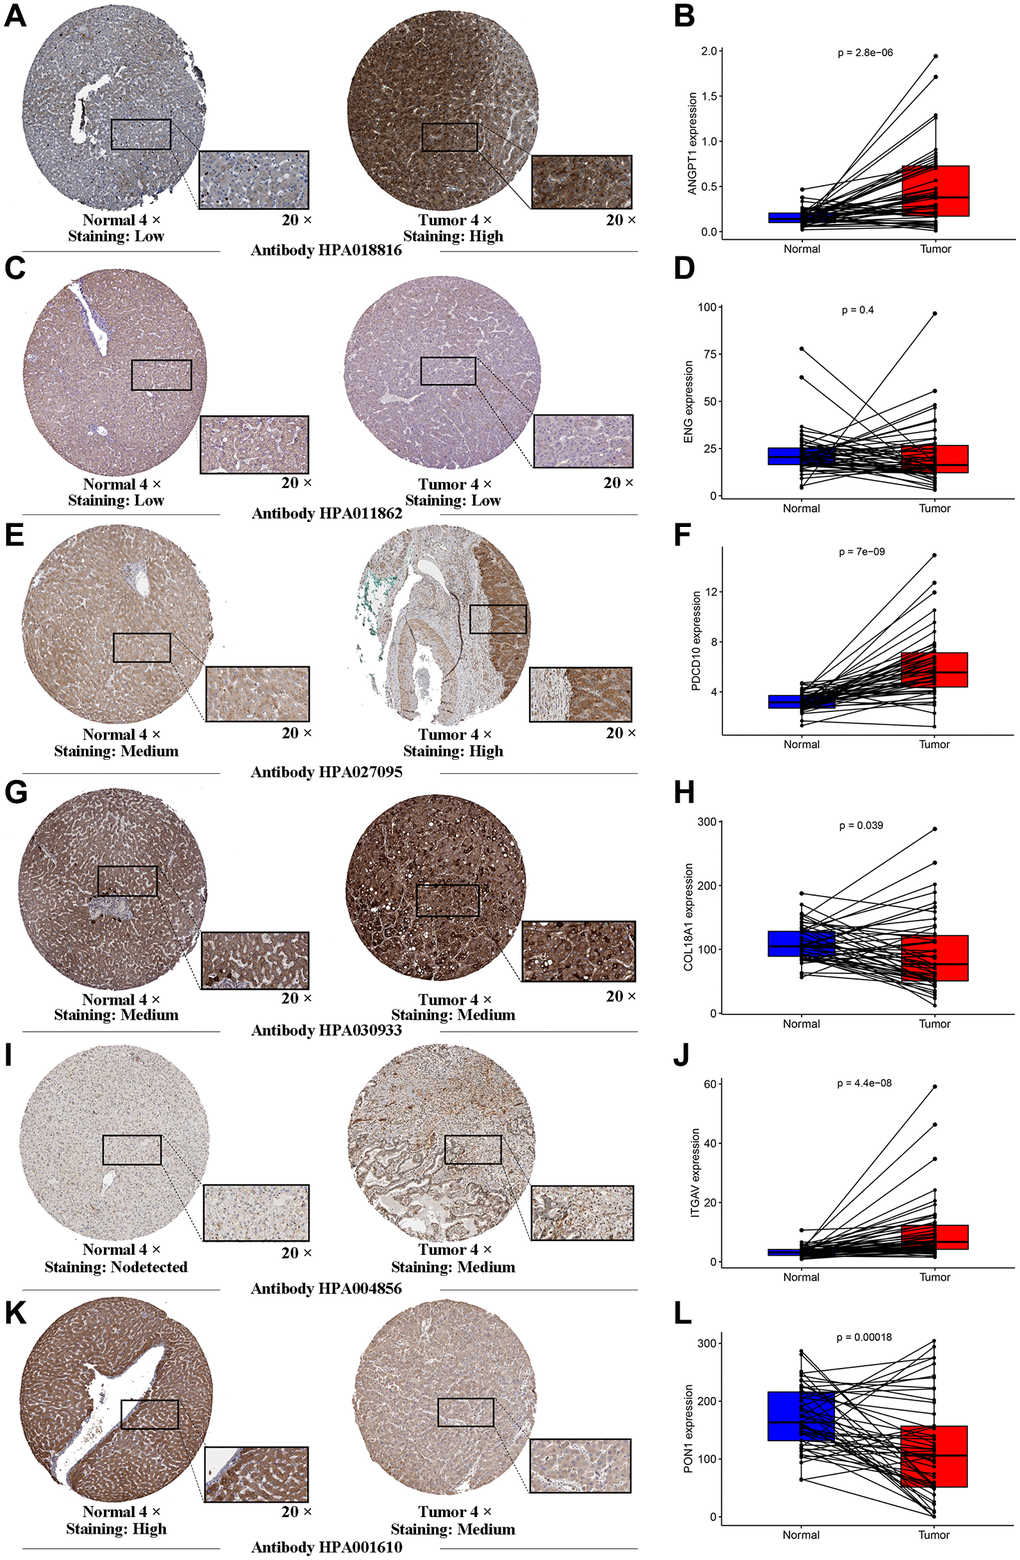
Figure 5.Human Protein Atlas immunohistochemistry of normal sample and tumor sample. The expression levels of ANGTP1 (A, B), ENG (C, D), PDCD10 (E, F), COL18A (G, H), ITGAV (I, J) and PON1 (K, L) in tumor and normal tissues were validated in the TCGA cohort, using the paired expression of the same individual normal tissue and tumor tissue.