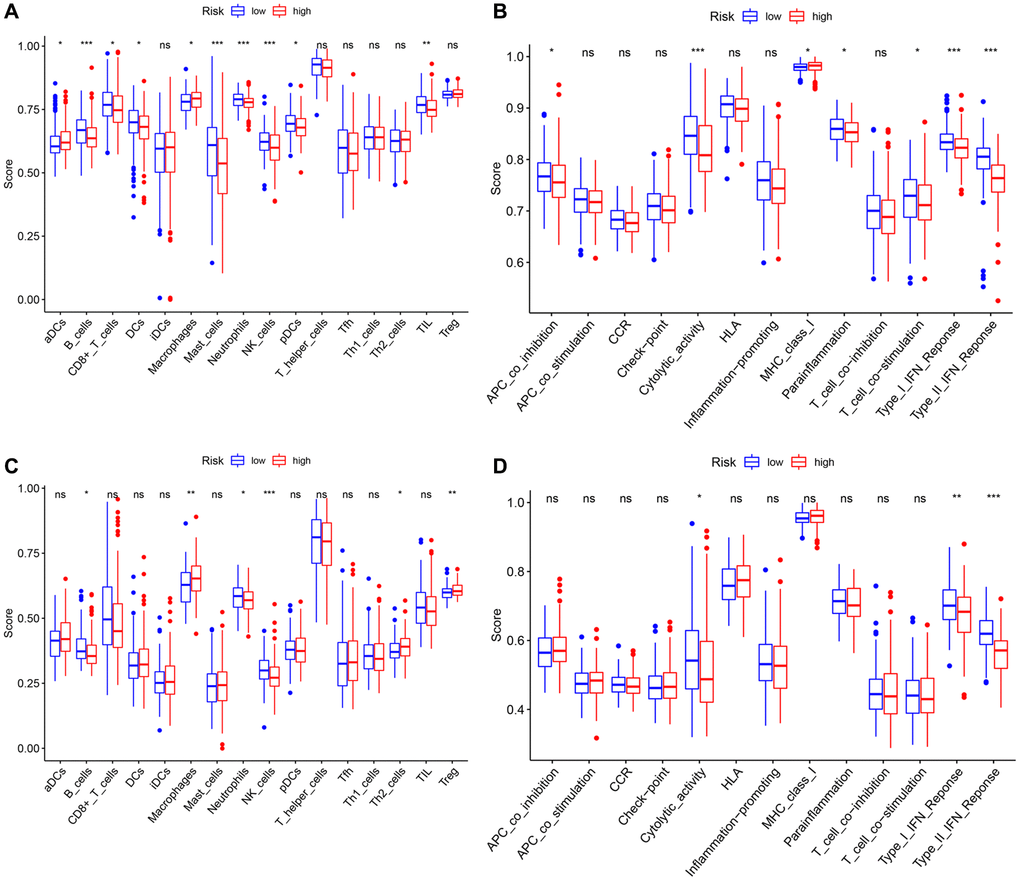
Figure 10.Comparison of the ssGSEA scores between different risk groups in the TCGA cohort and the ICGC cohort. The scores of 16 immune cells (A, C) and 13 immune-related functions (B, D) are displayed in boxplots. P values were showed as: ns: not significant; *P < 0.05; **P < 0.01; ***P < 0.001.