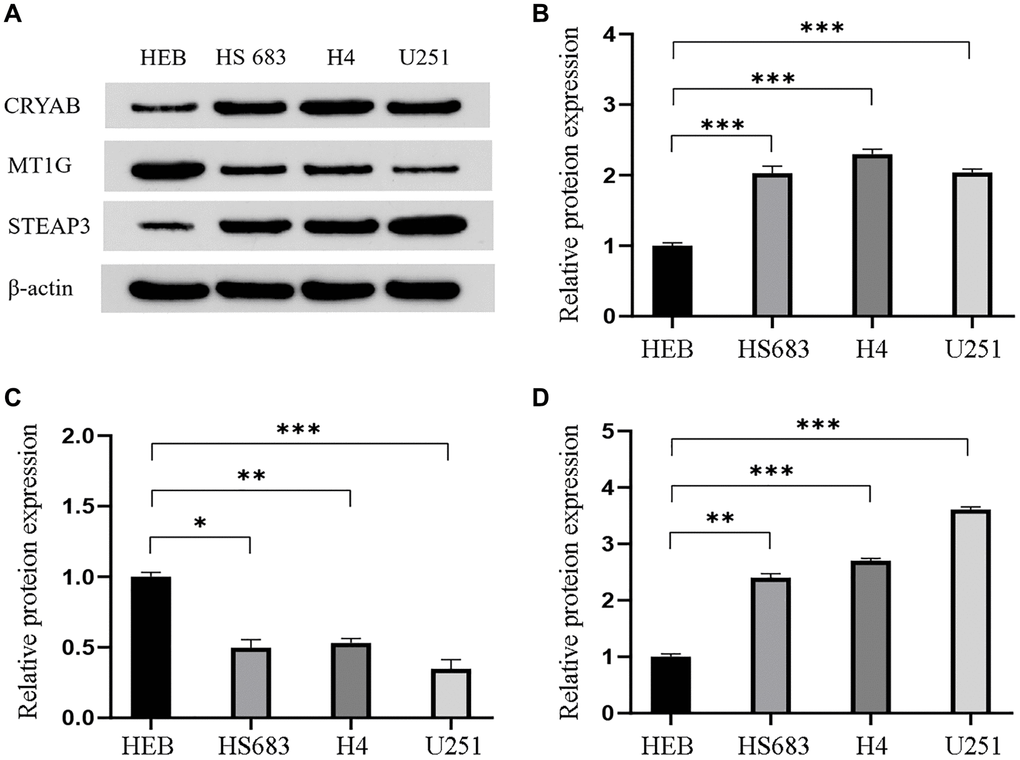
Figure 6.Validation of the differential expression of the three genes in GBM cells. (A) Western blot images and the relevant quantification (B–D) of CRYAB, MT1G, and STEAP3. Data are shown as mean ± SEM from three independent experiments, *P < 0.05, **P < 0.01, ***P < 0.001.