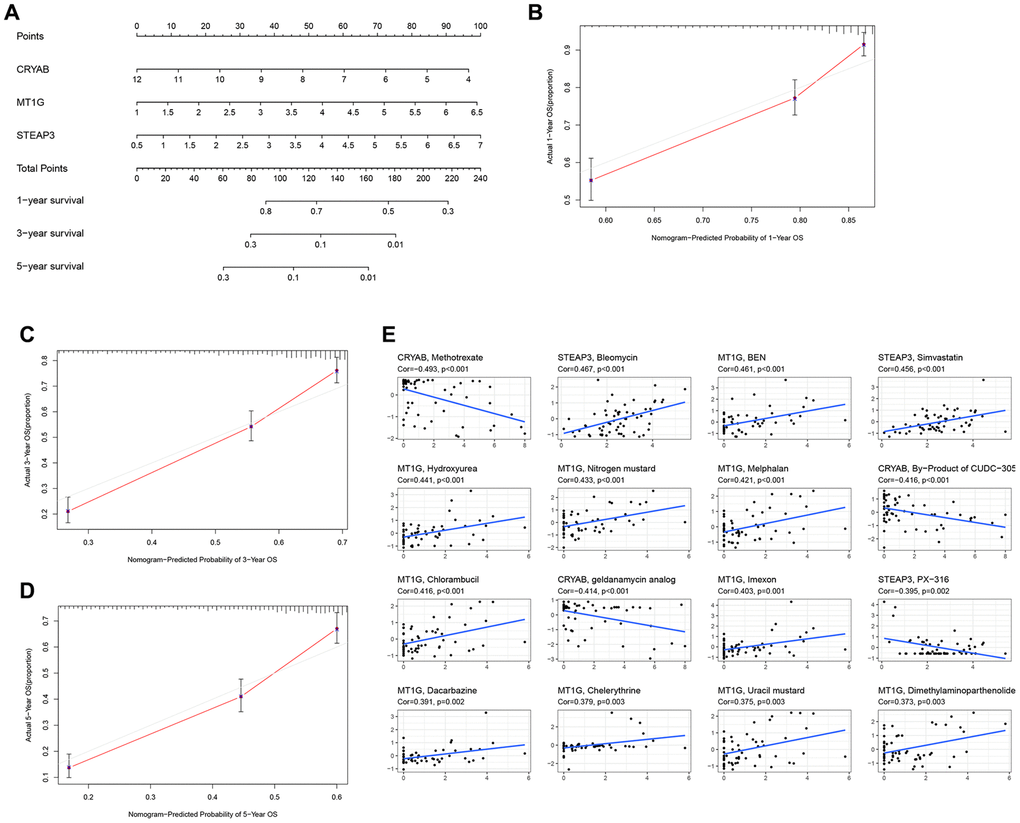
Figure 3.Construction of a nomogram and drug relevance based on the 3 hub FRGs. (A) Validation of the nomogram in the TCGA cohort. (B–D) Calibration maps used to predict the 1-year (B), 3-year (C), and 5-year survival (D). (E) The correlation between gene expression levels and drugs. The top 16 most relevant were visualized.