Submit an Article
Navigate
Home
Editorial Board
Editorial Policies
Current Volume
Archive
Scientific Integrity
Publication Ethics Statements
Interviews with Outstanding Authors
Newsroom
Sponsored Conferences
Podcast
Contact
Special Collections
Submit an Article
Online ISSN: 1945-4589
Research Paper
|
Volume 13, Issue 13
|
pp. 17638–17654
Pretreatment neutrophil-to-lymphocyte ratio predicts the benefit of gastric cancer patients with systemic therapy
Back to article
Figure 2
(2 of 5)
−
100%
+
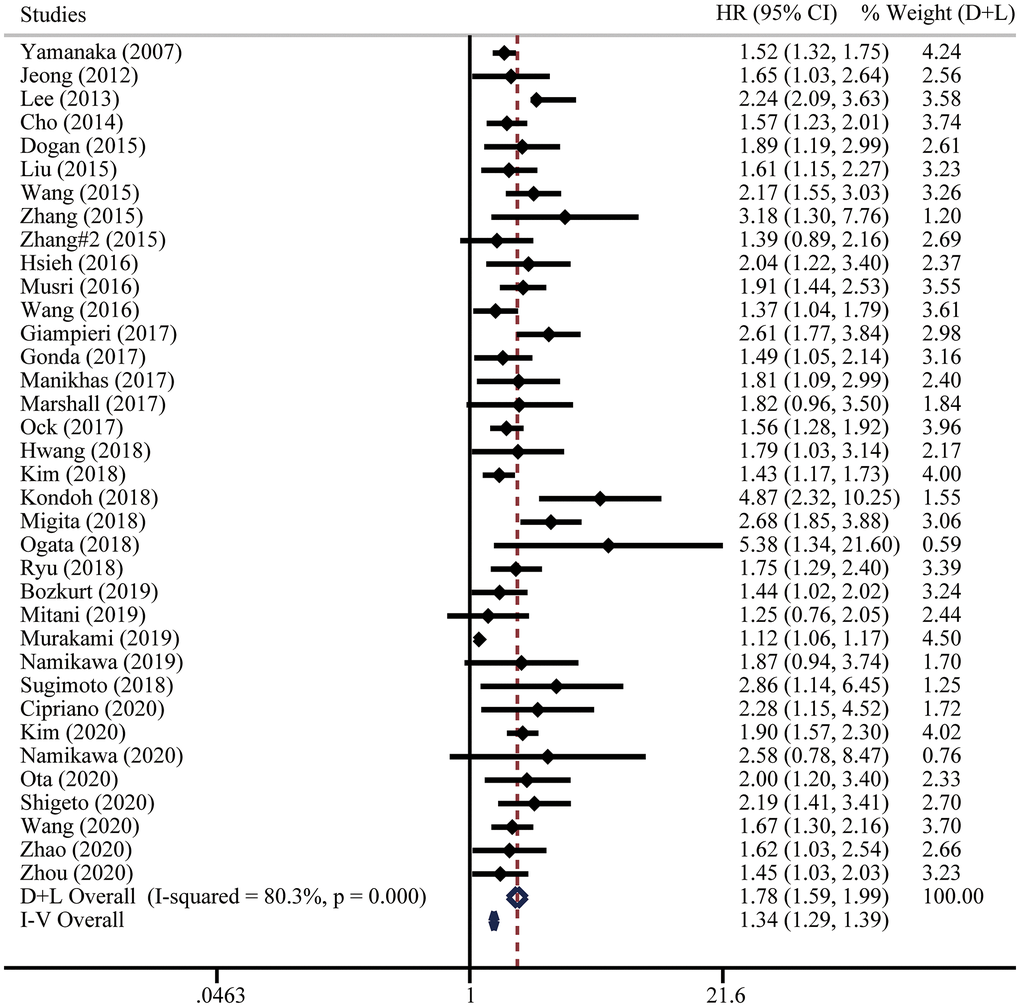
Figure 2.
Forest plot for the hazard ratios (HRs) of overall survival (OS) in gastric cancer patients with systemic therapy between low and high pretreatment NLR.
“D+L” means DerSimonian and Laird method. “I-V” means generic inverse variance method.