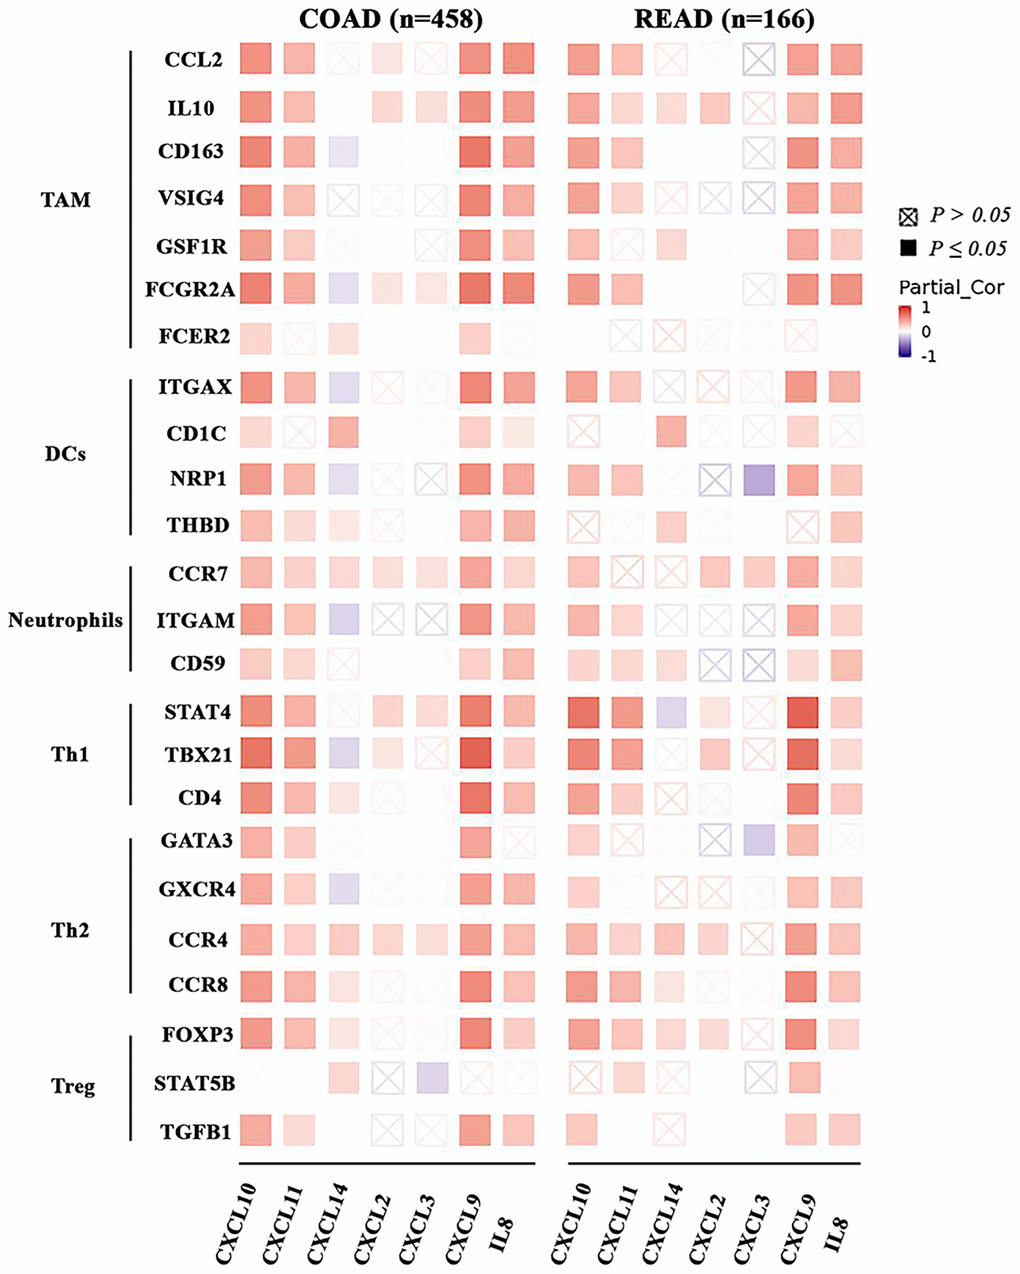
Figure 8.The association between the CXC chemokines expression and immune markers in ad heatmap table across COAD and READ. The red indicates a statistically significant positive association (P ≤ 0.05, rho > 0), and the blue indicates a statistically significant negative association (P ≤ 0.05, rho < 0). White denotes a non-significant result (P > 0.05).